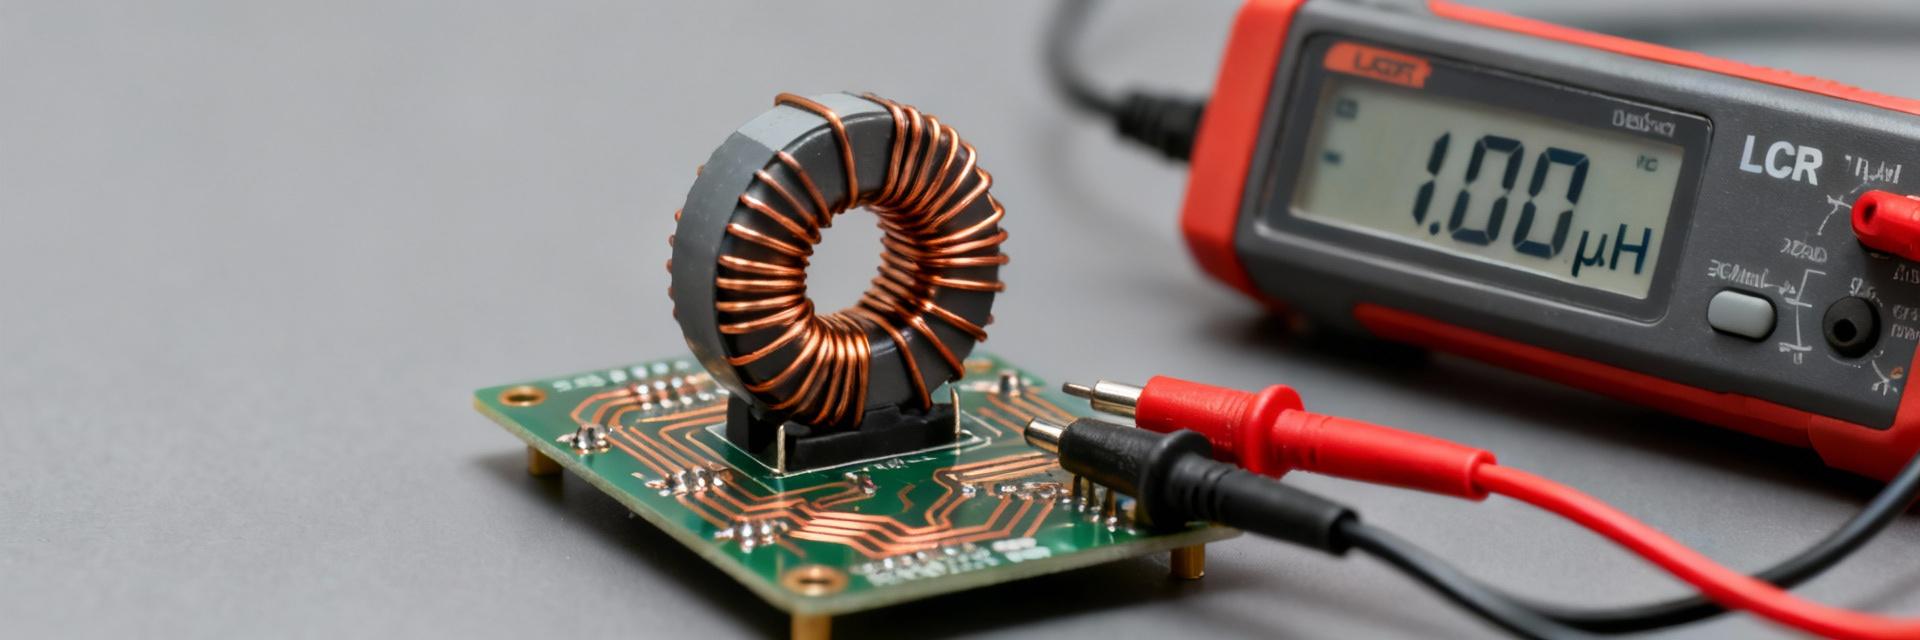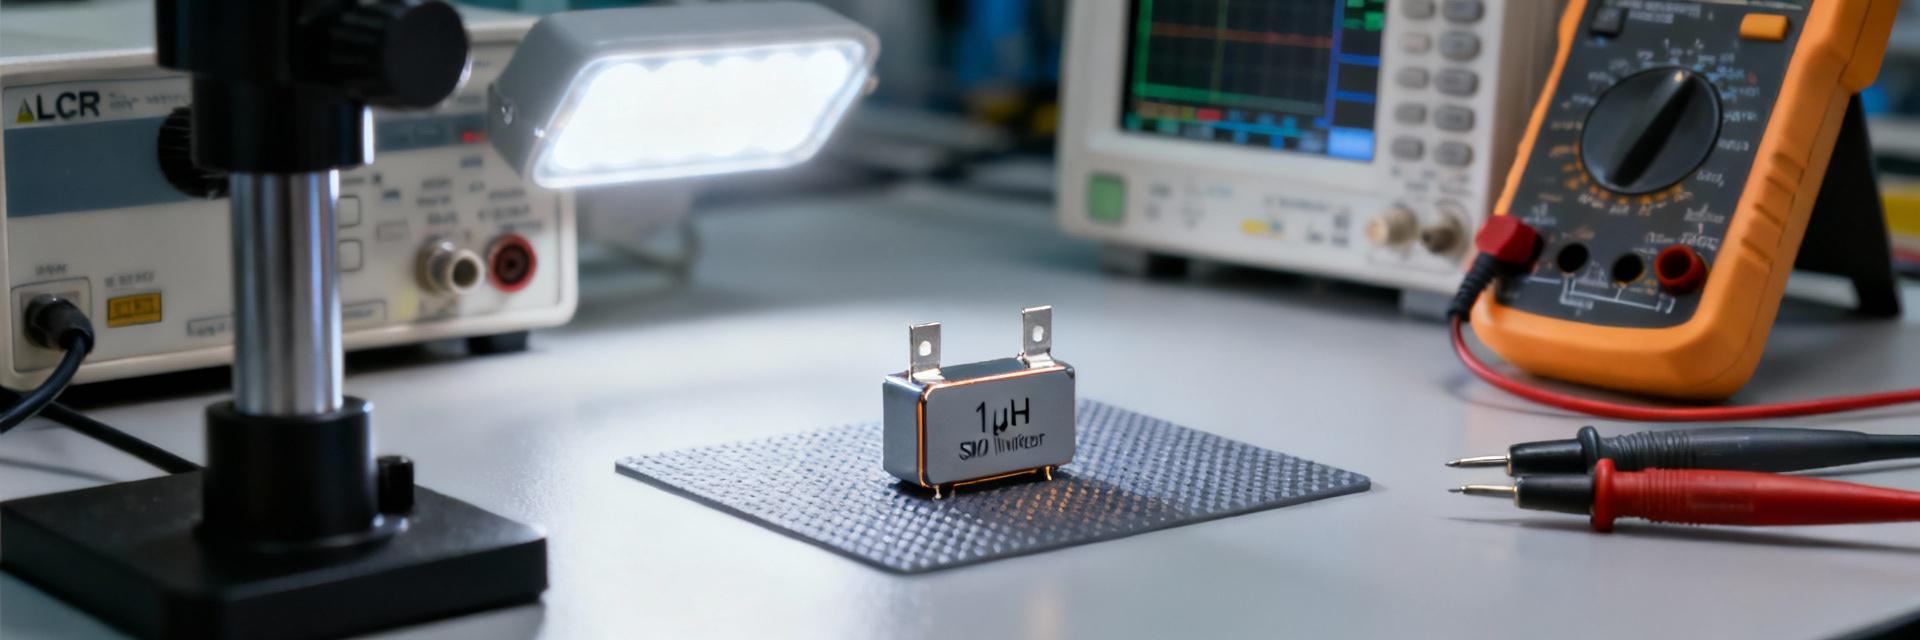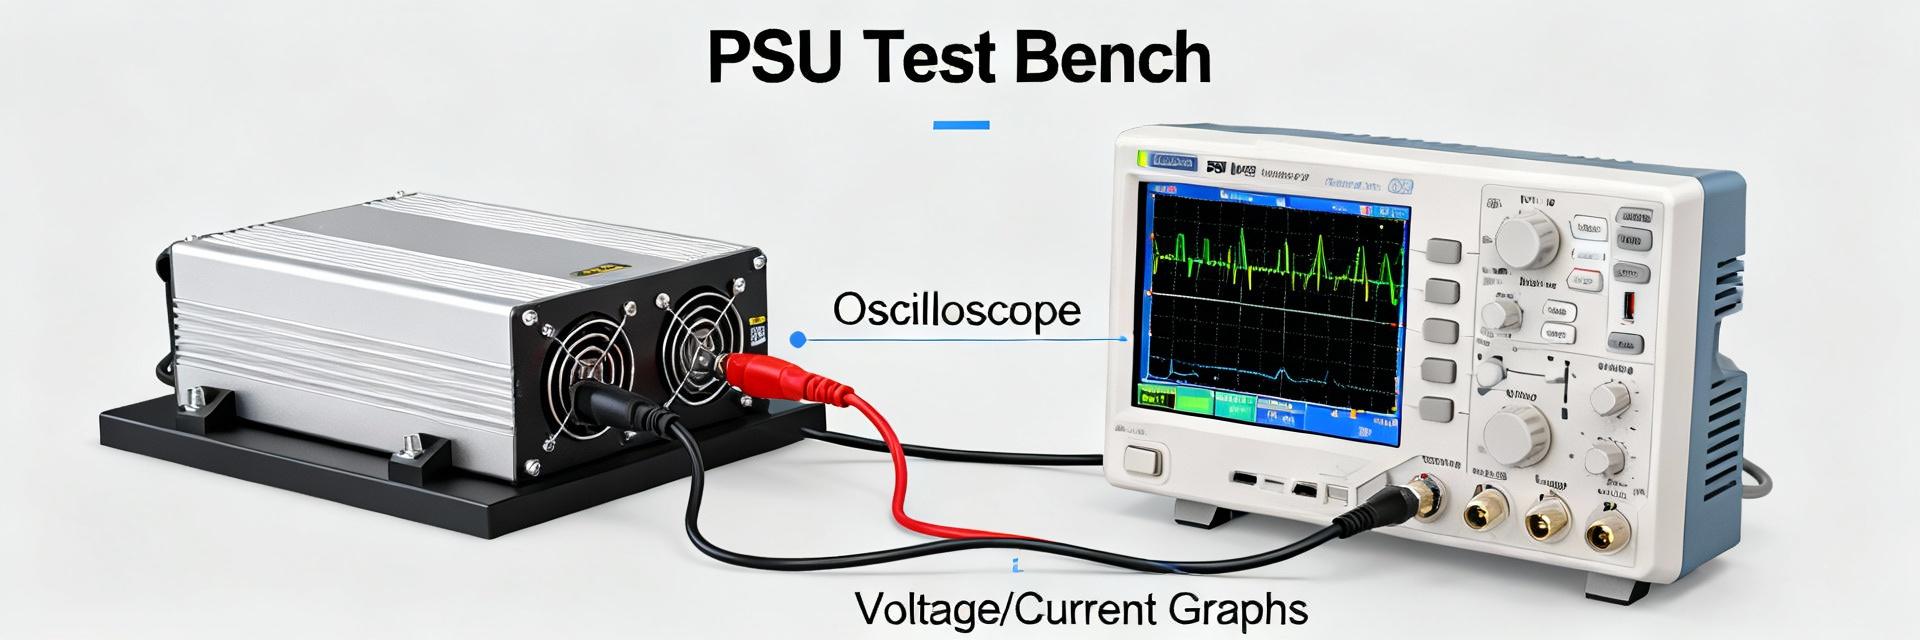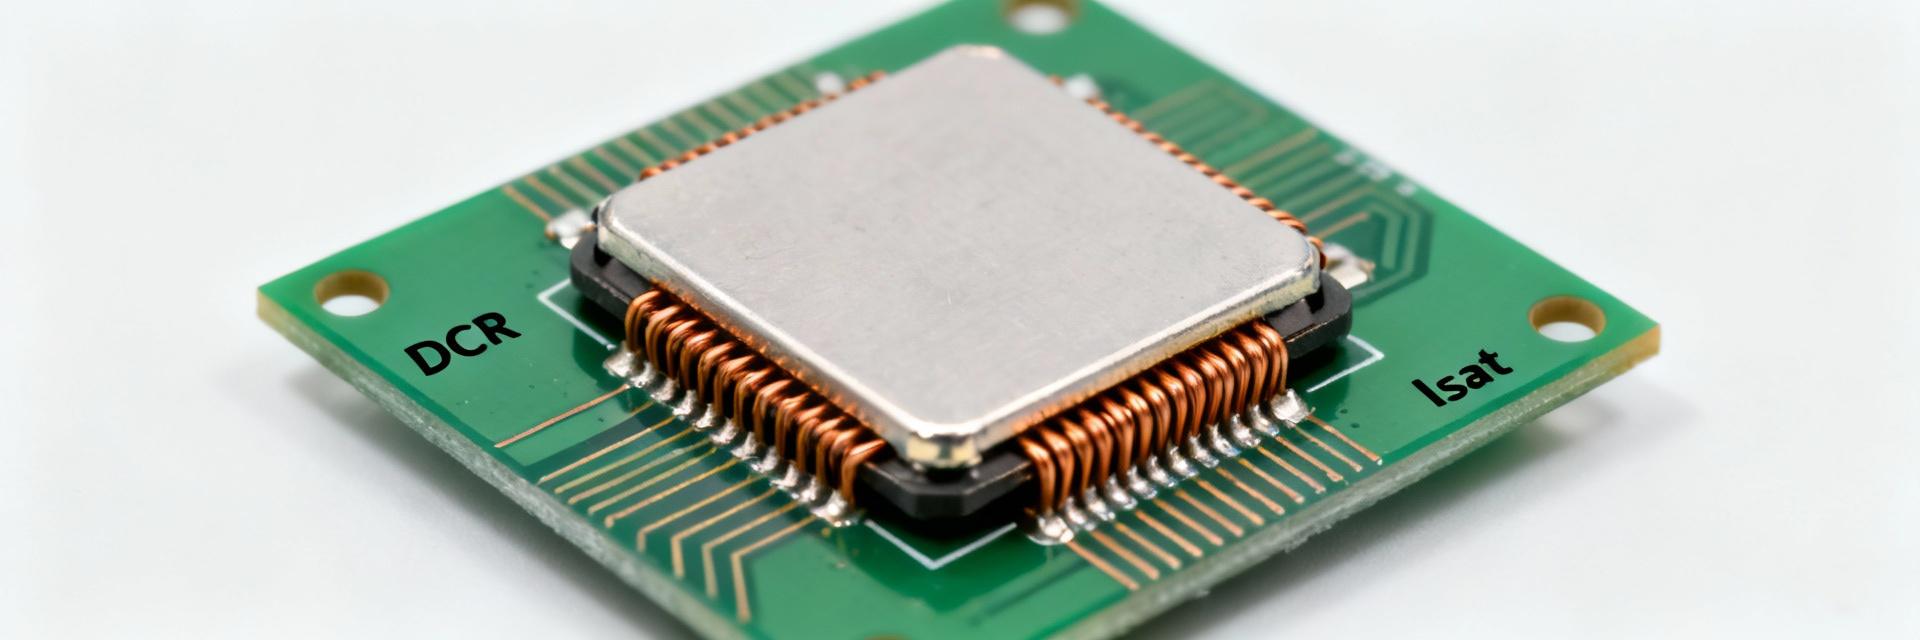
Measured bench performance shows the component delivering approximately 2.2 µH nominal inductance, a saturation/current capability in the ~7 A range (defined at the L-drop criterion), and DC resistance in the single-digit milliohm range under typical test fixtures. These metrics directly affect converter efficiency, I²R losses, thermal rise and EMI, so translating the official datasheet into repeatable bench procedures and practical derating rules is essential for robust power designs.
Product overview & quick specs (background)
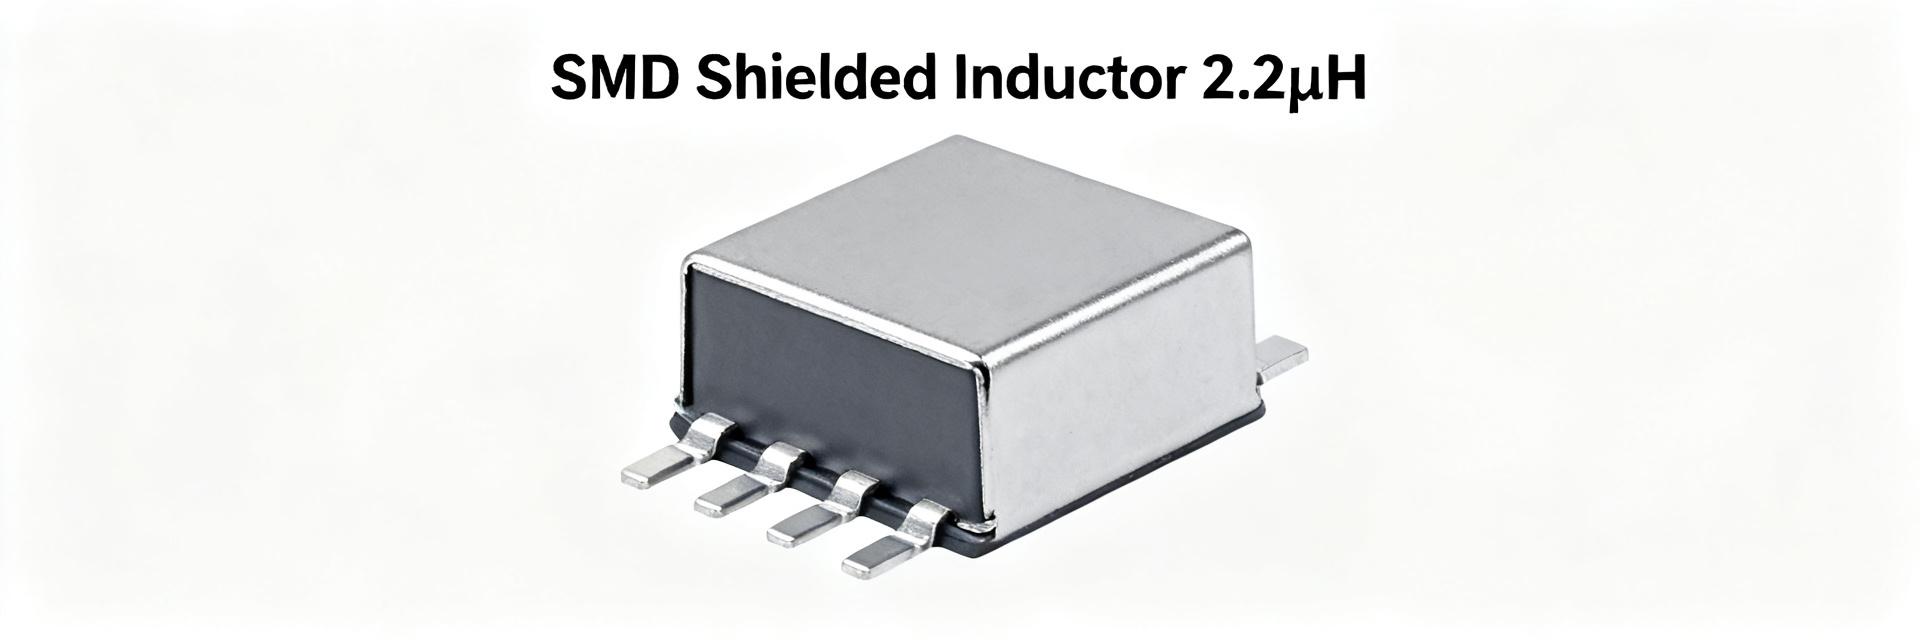
What the 784771022 is (component description)
This part is an SMD shielded power inductor in a compact rectangular package, implemented as a wirewound drum/stacked ferrite core optimized for high-current point-of-load use. It is intended for synchronous buck, boost and DC-DC module front-ends where low DCR, good saturation margin and shielding reduce conduction losses and limit radiated emissions in dense layouts.
Quick-spec summary table (must-have fields)
Compact spec (typical test conditions): inductance ≈ 2.2 µH ±20% (measured at 100 kHz, 0.1 Vrms);
Irms continuous: ≈ 5–6 A;
Isat: ≈ 7 A (30% L drop criterion);
DCR typical: ~6–12 mΩ, max per lot noted on datasheet;
SRF: not specified on some listings—measure on 1 MHz–100 MHz sweep;
Dimensions: L×W×H in mm per marking;
Recommended reflow: peak 245 °C, time above liquidus 30–60 s;
Operating: −40 °C to +125 °C.
Note: confirm absolute values vs official datasheet and test-fixture specifics.
Electrical performance: frequency & current behavior (data analysis)
Inductance vs frequency and loss characteristics
Inductance typically falls with frequency as skin and core losses rise; expect a few percent drift from low-frequency L to mid-band and a sharper roll-off approaching SRF. Core loss becomes relevant above several hundred kilohertz; report L(f) and Z(f) on log frequency axes and include magnitude and phase to assess converter impedance at switching harmonic content when selecting switching frequency.
Current ratings, saturation behavior & DCR impact
Irms is a thermal/continuous rating; Isat is defined by a chosen % L drop (commonly 25–30%). Use L(I) curves to find usable inductance at peak currents. Calculate I²R loss with DCR(T) and expected ripple/peak currents; derate Irms when ambient or board temperature rises. Example: at 6 A RMS and DCR 10 mΩ, loss ≈ 0.36 W—estimate PCB thermal resistance to predict temperature rise.
Thermal, mechanical and soldering performance (data analysis)
Thermal behavior, derating & reliability limits
Maximum component temperature generally limited by core and winding insulation—use a board-level ceiling (e.g., 125 °C). Apply derating: reduce rated Irms by ~10–20% for ambient >70 °C, and more when airflow is limited. For reliability, consider thermal cycling and time-at-temperature cumulative damage; track lot variance and perform life testing under rated current to quantify drift in inductance and DCR.
Package, PCB footprint and reflow profile
Follow recommended land pattern with generous solder fillets under terminals for thermal conduction; typical mechanical tolerances are ±0.2 mm. Use standard Pb‑free reflow: peak ~245 °C, time above liquidus 30–60 s. Avoid aggressive preheat ramps and handling while hot. For pick-and-place, ensure flat seating and pick-strength limits to prevent terminal damage.
Measurement & test methodology (method guide)
How to measure inductance, DCR and Isat accurately
Use an LCR meter for L at 100 kHz/0.1 Vrms with fixture compensation. Measure DCR with a 4-wire Kelvin micro-ohmmeter or low-resistance DMM, averaging several readings. For Isat, use pulsed test to avoid heating: apply current pulses (≤1 s) while capturing L(I) or V response; define Isat at the specified L reduction. Watch for fixture inductance and contact resistance artefacts.
Environmental & qualification tests to replicate datasheet claims
Replicate datasheet claims with thermal shock, solderability, humidity and vibration tests. Recommended engineering validation includes at least 10 samples per lot for electrical characterization, thermal life at rated current for 1000+ hours, and solder reflow soak tests. Record pass/fail criteria, measurement uncertainty and lot traceability for procurement and design approval.
Typical applications, design examples & layout guidance (case study)
Typical circuits and reference design snippets
Primary uses: synchronous buck converters for point-of-load, boost regulators and DC power modules. Example: 12 V→1.2 V @ 20 A buck at 500 kHz—choose inductance to set ripple (ΔI ≈ Vin·D/(L·fsw)), ensure Isat > Ipeak and DCR low enough to keep I²R losses acceptable. Compute ripple and losses to compare with alternative inductors in selection trade-offs.
PCB layout, EMI mitigation and assembly tips
Place the inductor near the load, minimize switching-node loop area with input capacitors close to the MOSFETs, and orient the shield to reduce coupling to sensitive traces. Use recommended input/output capacitor types and keep high di/dt traces short. For EMI, add small RC snubbers or damped-L networks if ringing is observed. Verify emissions with board-level testing.
Ordering, compliance, alternatives & selection checklist (action)
Ordering, packaging and traceability notes
Typical packaging: tape-and-reel for automated assembly, smaller volumes in trays. Decode ordering codes for package size and tolerance, and request date codes and lot test data. Always obtain the official datasheet PDF and certificate of conformity before procurement to verify electrical limits and reflow qualifications for production acceptance.
How to choose substitutes and cross-reference criteria
Checklist for substitutes: match inductance, Irms/Isat criteria, DCR, footprint and height, and confirm thermal rating and measurement conditions. Prioritize lower DCR when efficiency is critical, higher Isat when peak currents dominate, or smaller size when board space is constrained. Flag candidates that require requalification on your application board.
Key summary
- Convert datasheet numbers into bench metrics: verify inductance, DCR and Isat under your fixture to predict converter efficiency and thermal behavior.
- Use the provided measurement procedures to generate L(f), L(I) and impedance graphs that guide switching-frequency and ripple decisions.
- Apply conservative thermal derating and layout practices to limit I²R losses and EMI; confirm packaging and lot traceability prior to production.
Frequently Asked Questions
How do I reproduce the inductance vs current curve for 784771022?
Use an LCR meter for low-current L baseline, then perform pulsed-current L(I) sweeps: apply short duty pulses at incrementing DC bias levels, measure apparent L from voltage/current transients, and plot normalized L vs DC current. Ensure fixture compensation, thermal stabilization between pulses, and consistent waveform timing for repeatability.
What is the best method to estimate temperature rise from DCR losses?
Calculate Joule loss P = I²·DCR (use RMS current including ripple). Determine board thermal resistance from component to ambient (θ_CA) via measurement or thermal simulation and multiply P·θ_CA for temperature rise estimate. Validate with thermocouple measurements on a populated board under steady-state current.
When should I prioritize lower DCR over smaller size in part selection?
Prioritize lower DCR when converter efficiency and thermal budget are primary constraints (high continuous current, minimal cooling). Choose smaller size when board area is scarce and currents are moderate. Always re-evaluate EM and saturation trade-offs and perform board-level requalification when changing footprints or core materials.
Summary
Download and verify the official 784771022 datasheet PDF, then reproduce inductance, Isat and DCR measurements on your bench using the procedures above. Apply the layout, thermal derating and EMI guidance to your converter, and confirm packaging and lot traceability before production. Use the measurement procedures above to reproduce datasheet graphs on your bench.