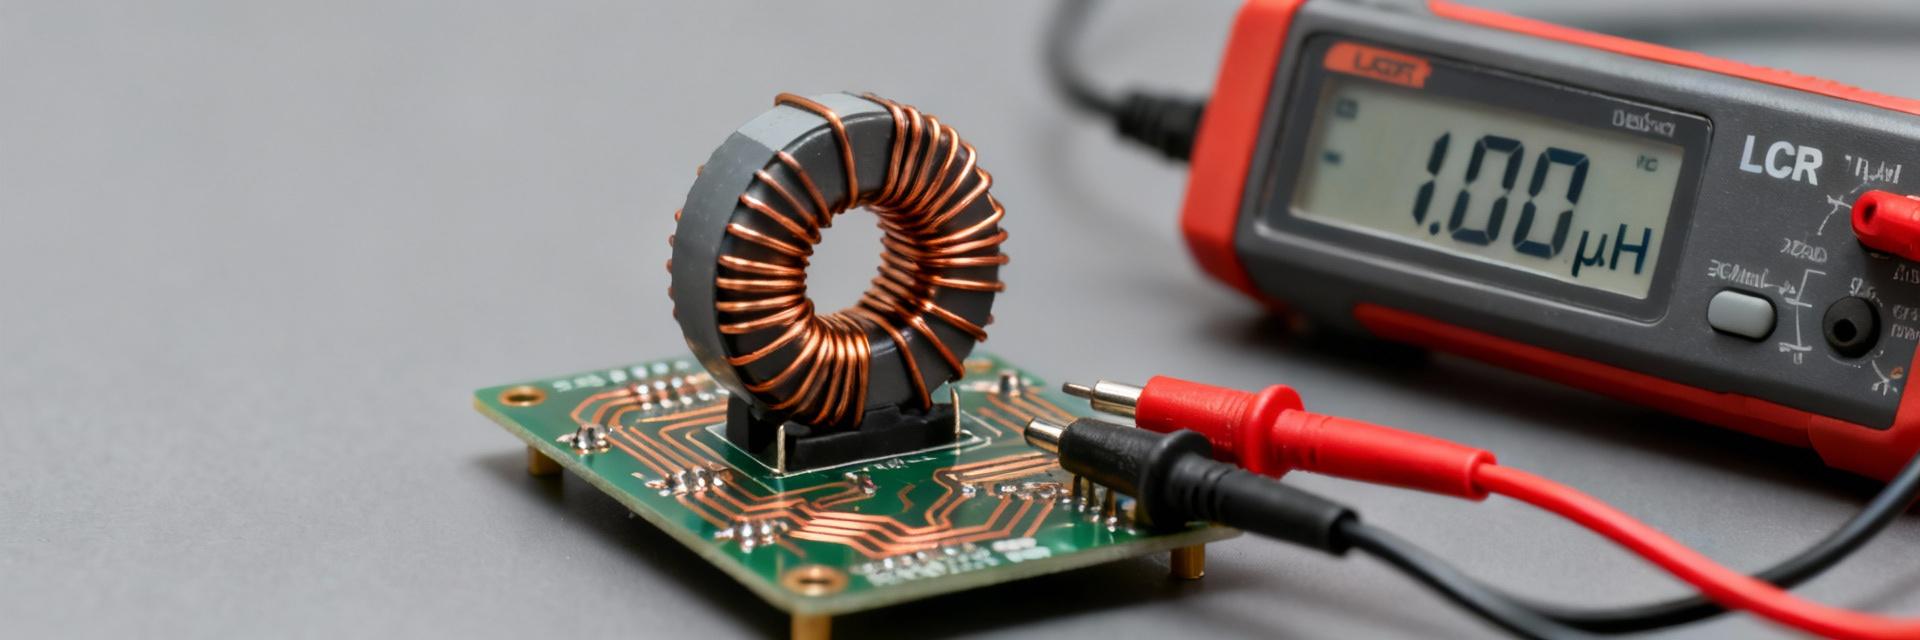
Point: This report opens with a concise data snapshot for quick engineering triage.
Evidence: Nominal inductance 1 µH, DCR single-digit mΩ, Irms ~9 A, Saturation currents in low double-digit amps.
Explanation: Compare measured vs. datasheet performance and define pass/fail criteria for the 784771010 part.
Point: The scope is practical and test-driven.
Evidence: measured vs. datasheet tables, L(f) and L(I) curves, DCR vs. temperature, and thermal soak data are included as recommended deliverables.
Explanation: readers will get test protocols, reporting templates, and a short BOM spec so teams can validate production samples quickly and consistently for a 1uH SMD power inductor application.
1 — Background & Key Specifications
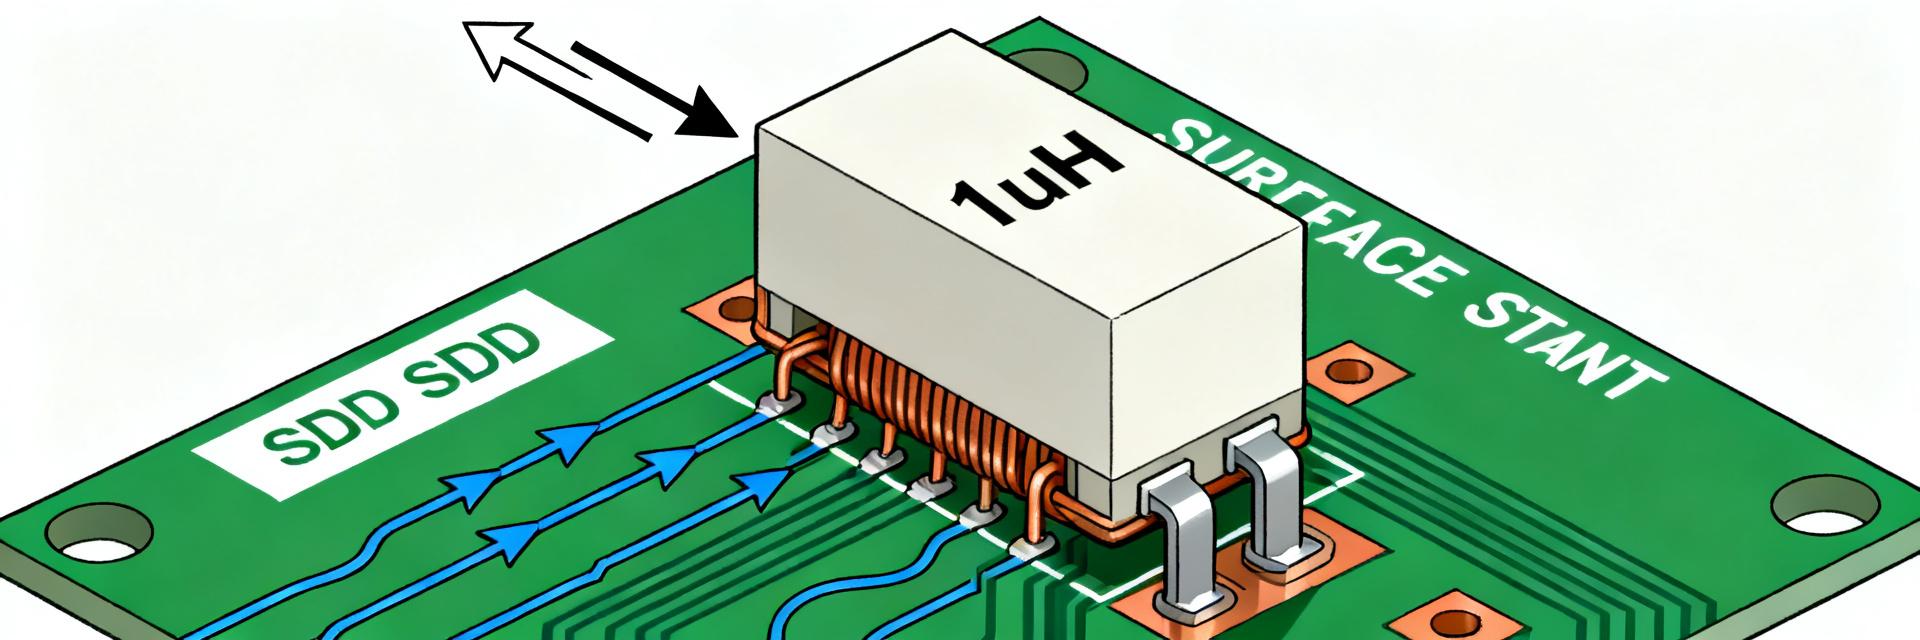
Component ID & Intended Applications
Point: Identify the device and its target topologies.
Evidence: part identifier is 784771010 and common use cases include synchronous buck converters, point-of-load regulators, and high-current distribution rails where a 1uH SMD power inductor is selected for energy storage and ripple filtering.
Explanation: the 1 µH value balances storage and switching frequency tradeoffs, and the package and current ratings determine suitability for tight-layout, high-current designs.
Datasheet vs. Real-World Spec Sheet
Point: Capture critical datasheet fields before testing.
Evidence: extract nominal inductance and tolerance, DCR, Irms (rated RMS current), Isat (saturation current), temperature rise at Irms, impedance vs. frequency, package/footprint, and recommended solder profile.
Explanation: set pass/fail thresholds up front (e.g., L within ±20% at low frequency, DCR within datasheet tolerance ±20%, Irms derated to hold ≤40°C rise, Isat defined at 25% L drop) to avoid ambiguity in later measurements.
2 — Electrical Performance: Measured Data & Analysis
Inductance Stability & Frequency Response
Point: Define and execute an L vs. frequency plan.
Evidence: measure L from 20 Hz to 10 MHz with small-signal excitation and report percent deviation; captioned plot: 784771010 inductance vs frequency.
Explanation: acceptable behavior is stable L at low frequency within ±20%; watch for a pronounced drop approaching SRF, and document resonance peaks that affect EMI and loop stability.
DCR, IRMS, and Saturation Behavior
Point: Characterize resistive loss, heating, and bias collapse.
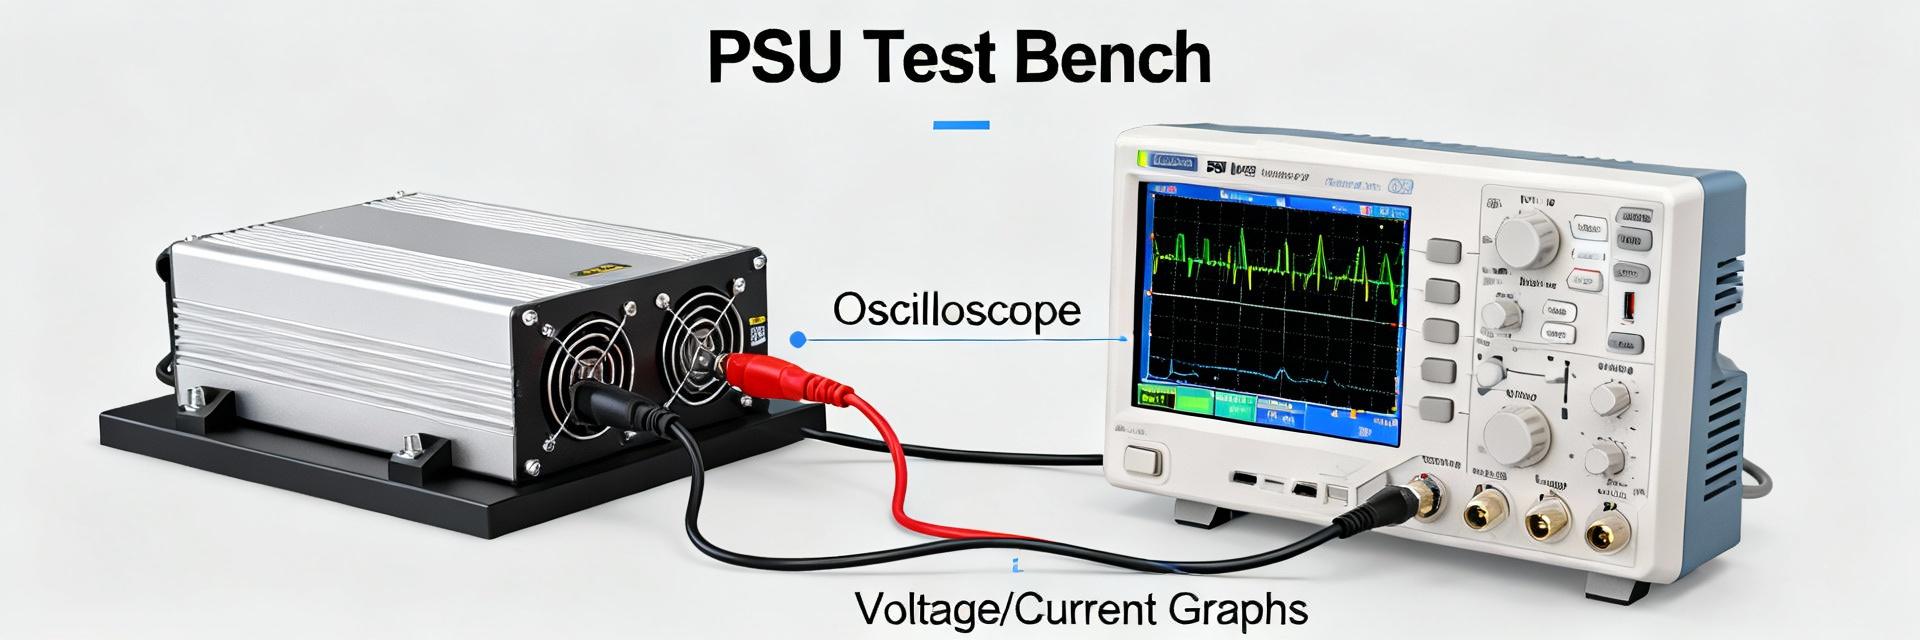
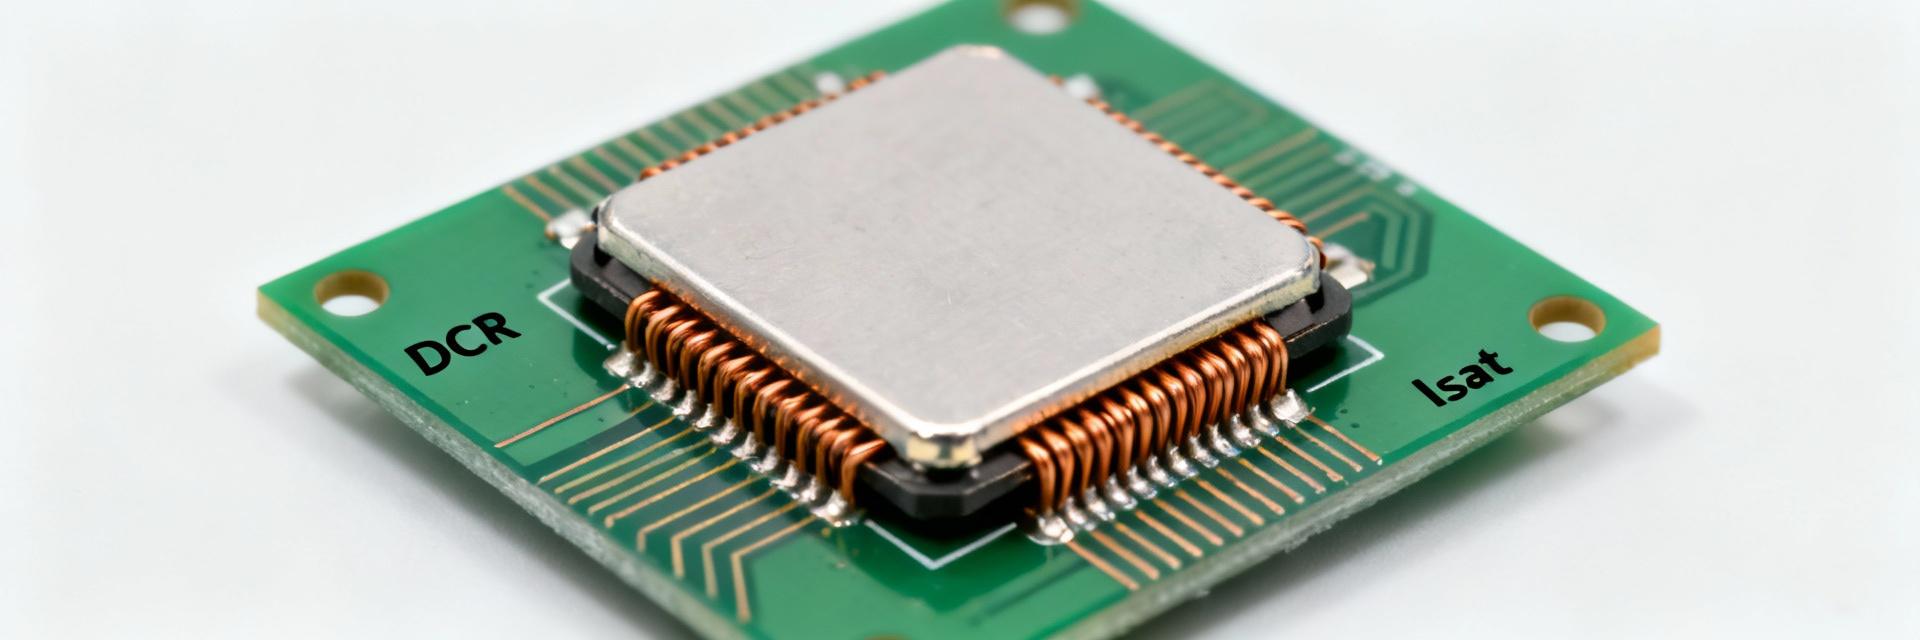
Evidence: use four-wire DCR, perform IRMS heating ramps (measure temperature rise vs. current), and determine Isat by incremental DC bias until L falls by defined percentage (commonly 10–25%).
Explanation: expect DCR to increase with temperature; pass criteria include DCR within tolerance and Irms derated so measured temp rise ≤ datasheet limit, with Isat comfortably above expected DC bias in the target topology.
3 — Test & Measurement Methodology
Test Equipment, Fixtures & Calibration
Point: Use calibrated, repeatable equipment and fixtures.
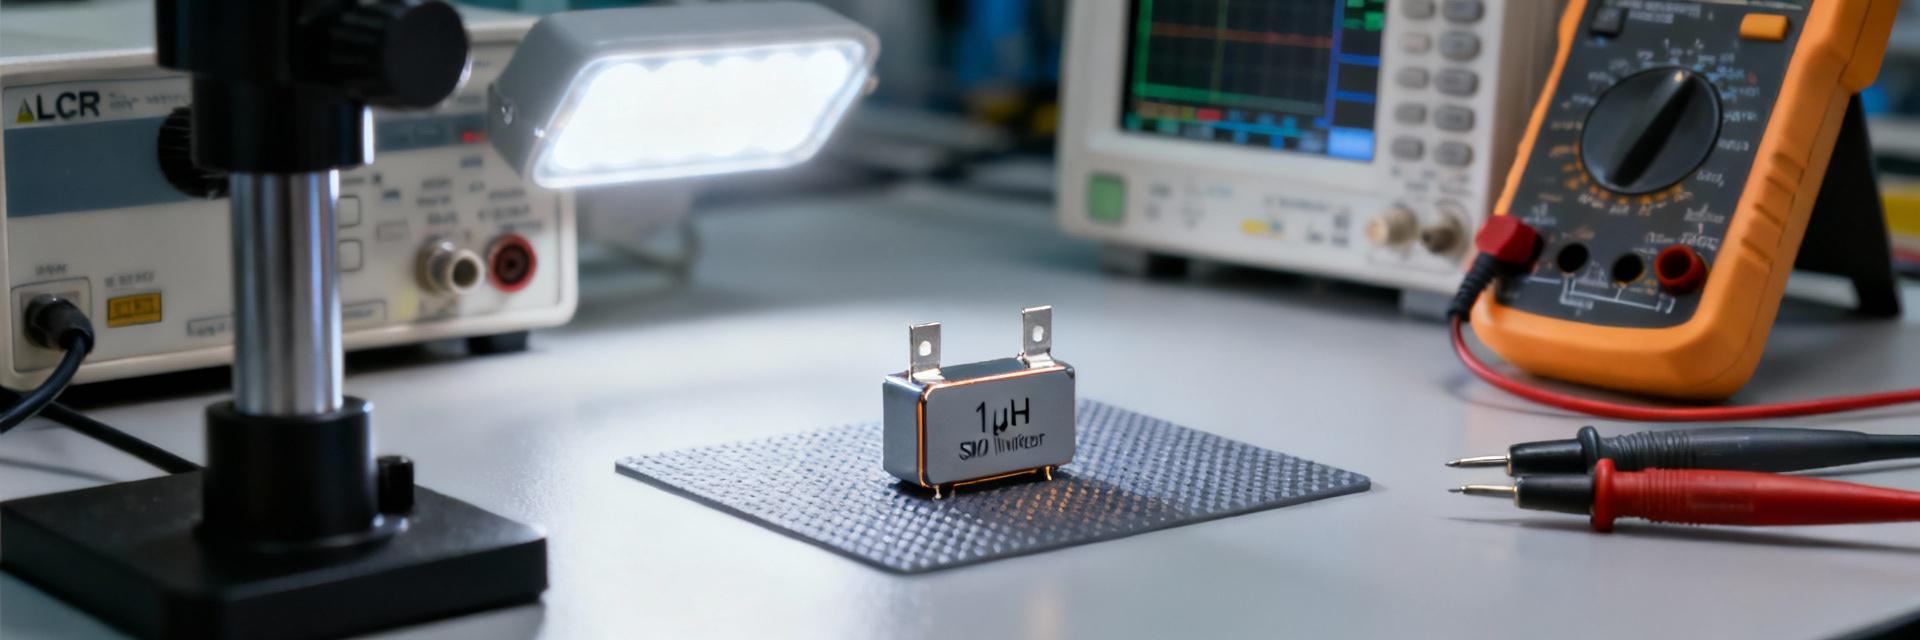
Evidence: recommended tools include a precision LCR meter or impedance analyzer, low-noise DC current source, four-wire kelvin fixtures, thermal camera or chamber, and fixture compensation standards.
Explanation: pre-test calibration and fixture compensation prevent systematic error; record instrument uncertainty and repeatability in the test log for defensible conclusions.
Test Protocols & Reporting Templates
Point: Standardize the sequence and reporting for reproducibility.
Evidence: a typical protocol: ambient baseline → reflow-conditioned sample → L(f) sweep → DCR and IRMS heating → Isat L(I) sweep → post-soak verification. Include "electrical report" in the title and metadata.
Explanation: report fields should include test ID, operator, sample lot, graphs, pass/fail summary, and uncertainty; embedding the phrase electrical report in metadata aids search and archival retrieval.
4 — Design Integration: PCB, Thermal & EMI Considerations
PCB Layout & Mechanical Footprint Guidance
Point: Layout affects electrical and thermal performance.
Evidence: recommended practices: follow vendor land pattern, provide thermal vias under/near part, keep switching node loop area minimal, route heavy copper for current paths, and allow clearance for heat rise.
Explanation: copper pours and vias reduce DCR-driven hot spots and lower impedance of return paths, improving efficiency and reliability under high Irms.
Thermal Management & EMI Mitigation
Point: Manage temperature and emissions proactively.
Evidence: derate current to meet specified temperature rise; use impedance vs. frequency data to place additional filtering at frequencies where inductance falls.
Explanation: when L collapses near Isat, conducted emissions can increase; mitigate with RC damping, layout separation, and common-mode filtering as needed to meet conducted-emission targets.
FAQ
What electrical measurements should be in the 784771010 test report?
Include L vs. frequency (20 Hz–10 MHz), L vs. DC bias (L(I)), four-wire DCR at ambient and after thermal soak, IRMS heating curves with temperature rise, Isat point (defined by % L drop), and uncertainty estimates. These fields provide a defensible pass/fail basis for production acceptance.
How should engineers derate the 784771010 for sustained current?
Derate Irms so that measured temperature rise under continuous current stays below your target (commonly ≤40°C). Use IRMS heating data to select a derating factor (often 60–80% of datasheet Irms) that preserves inductance and avoids thermal overstress in your assembly.
Which test artifacts belong in the final electrical report?
The electrical report should contain raw measurement tables, plotted graphs (L(f), L(I), DCR(T), impedance curve), test equipment and calibration records, pass/fail summary, and BOM spec entries. Standardized templates and metadata make the report actionable for procurement and design reviews.