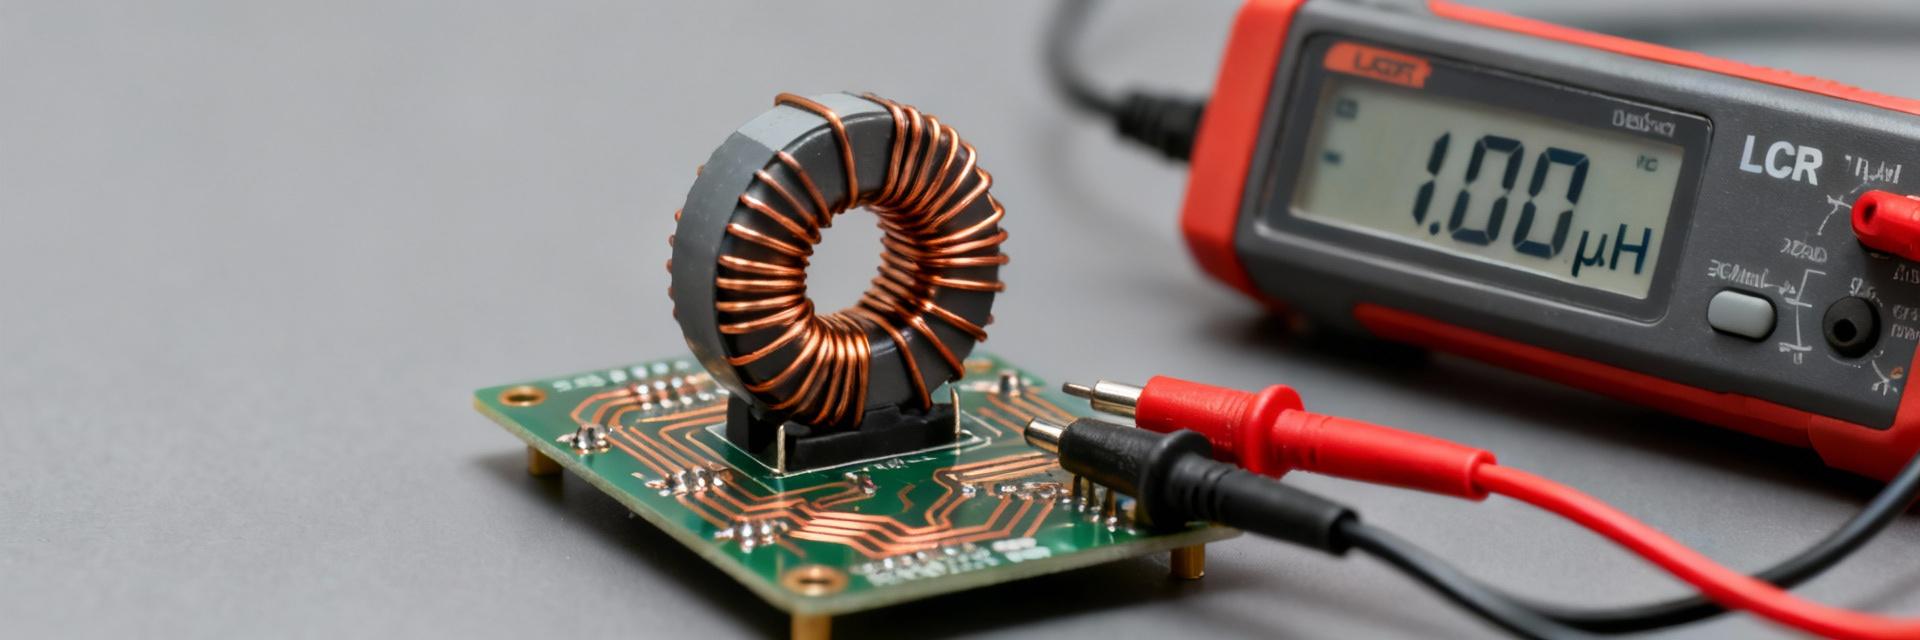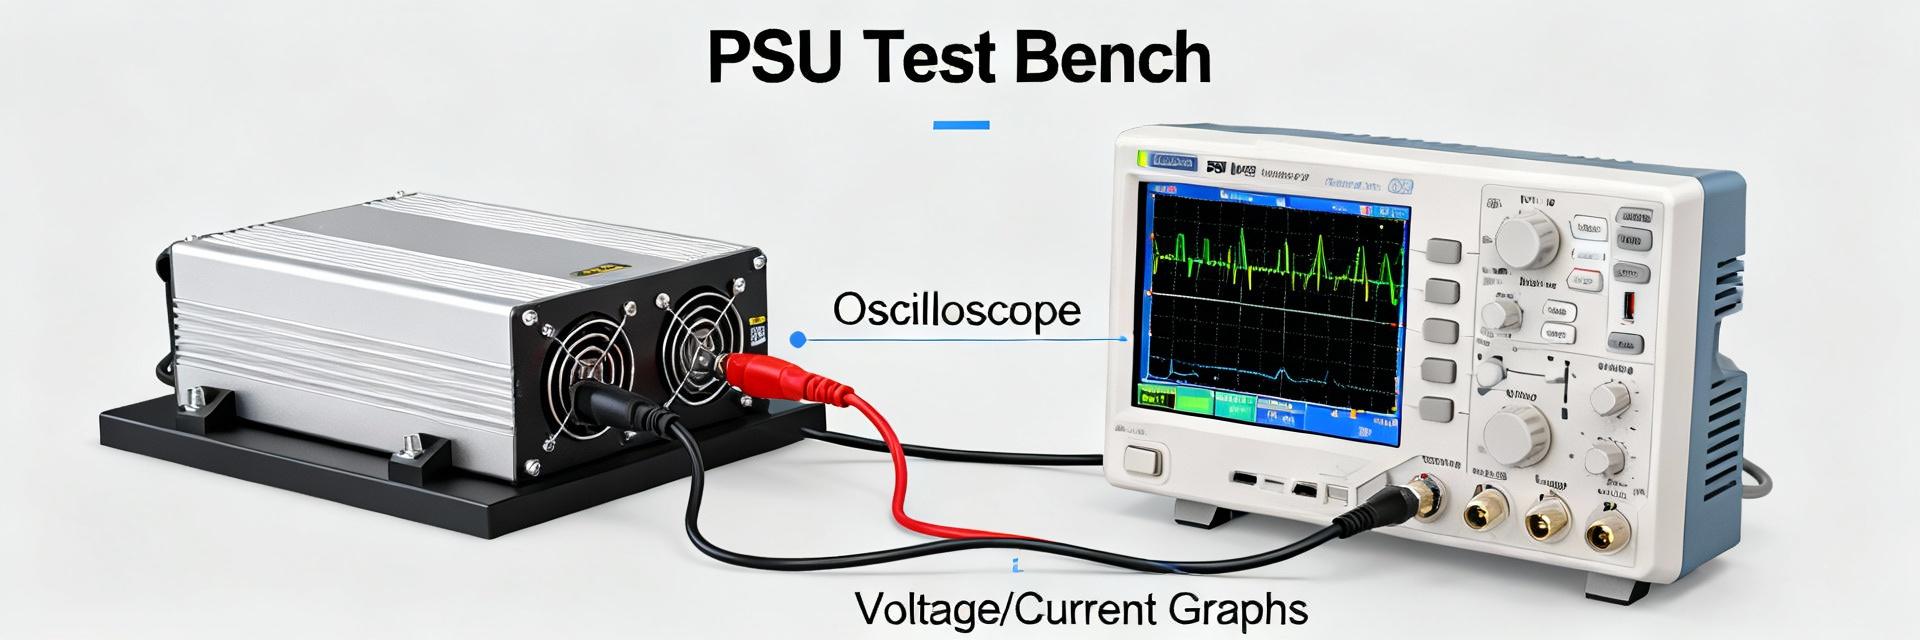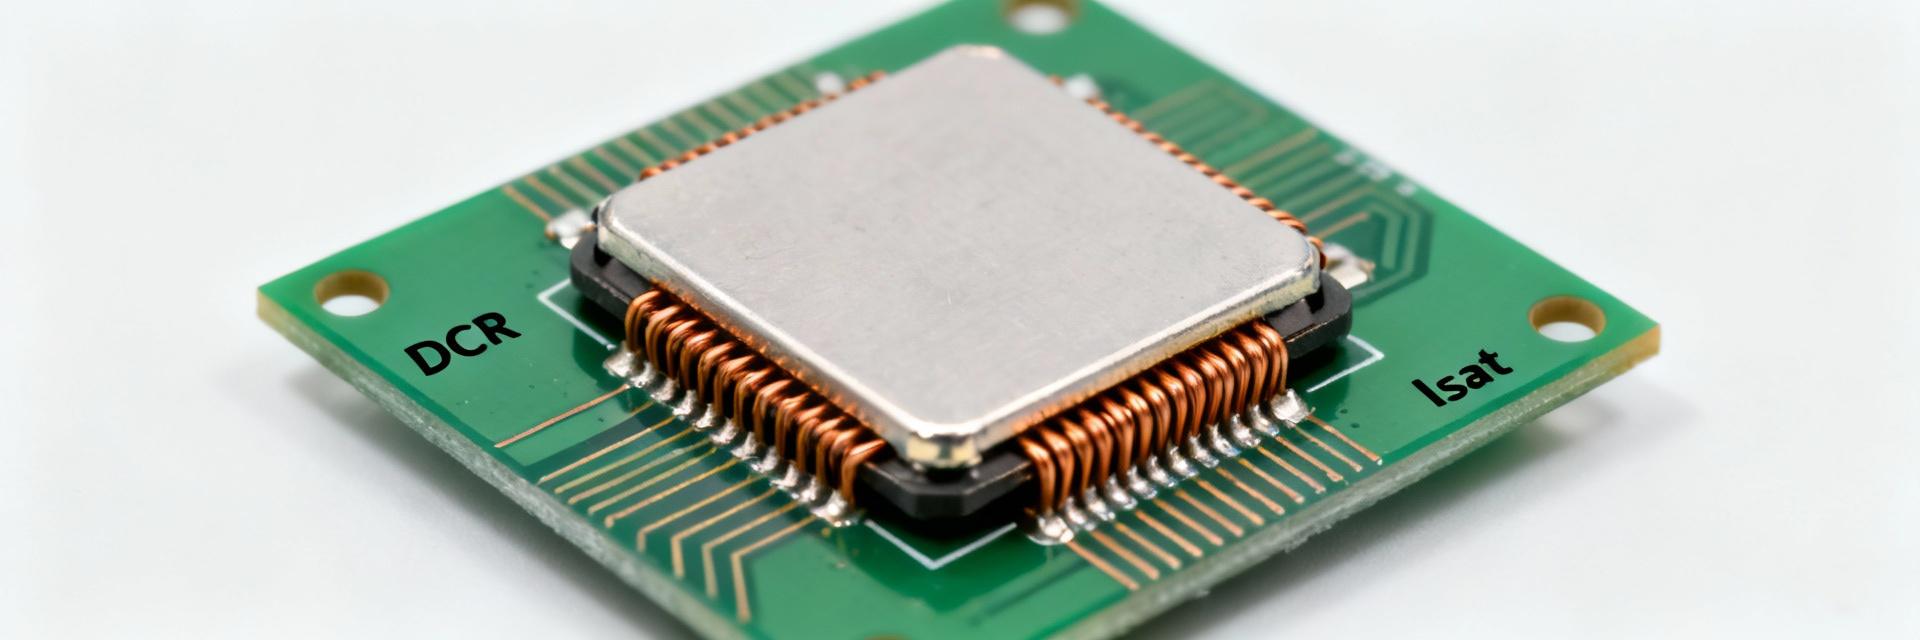
Bench measurements across a representative sample of 220µH SMD power inductors reveal substantial variation in inductance stability, DC resistance, saturation behavior and measured loss — differences that can change converter efficiency by multiple percentage points. This report covers what was measured (inductance vs frequency, DCR, Isat, core+Cu loss, thermal rise, and converter-level loss) and aims to give power-design engineers clear, data-backed selection and layout guidance for a 220µH SMD power inductor.
Point: meaningful selection requires repeatable test methods.
Evidence: catalog specifications and sample bench runs consistently show wide spread in key metrics.
Explanation: engineers who apply a standardized matrix get repeatable comparisons and avoid surprises at system level.
1 — Background: why a 220µH SMD power inductor matters (background intro)
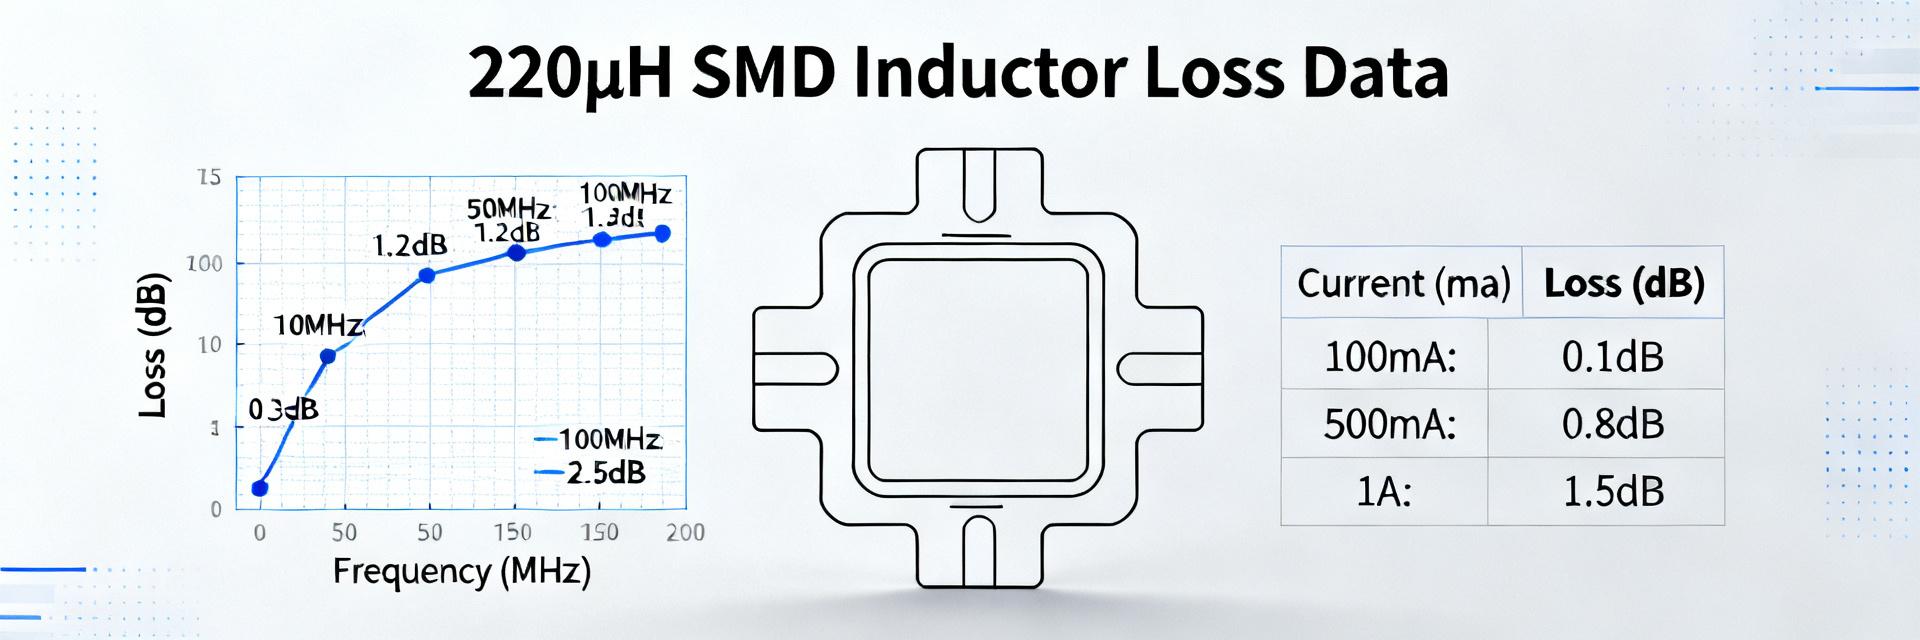
1.1 Common applications & expected nominal specs
Point: 220µH values are typically used for low-frequency buck/boost stages, EMI filtering, and energy storage on low-current rails.
Evidence: application notes and catalogs list 220µH parts for rails under a few amps with package styles from small rectangular SMD to larger shielded types.
Explanation: designers should expect trade-offs — higher inductance often means larger core, higher DCR and lower Isat — so size, current and loss must be balanced when targeting low-frequency converters.
1.2 Key parameters engineers must evaluate
Point: the critical metrics are inductance, DC resistance (DCR), saturation current (Isat), temperature rise, and core loss.
Evidence: bench and datasheet reporting usually include L at low frequency, DCR at room temperature, Isat defined by a specified % drop, and thermal rise per watt.
Explanation: each metric maps to system impact — inductance affects ripple and loop stability, DCR sets copper loss, Isat defines usable current margin, and core loss dominates at switching frequencies.
2 — Test setup & methodology: how we captured measured specs & loss data (data/method)
2.1 Test equipment, fixtures and measurement conditions
Point: reproducible results need calibrated instruments and controlled conditions. Evidence: practical setups use an LCR meter or impedance analyzer for L(f), a micro-ohmmeter or four-wire DCR measurement, a power analyzer for loss, a programmable DC source for bias and a thermal camera for temperature profiling. Explanation: specify DC bias points, a frequency sweep (10 Hz–1 MHz), controlled ambient temperature and use sine waves for AC L(f) and pulsed waveforms for saturation checks to avoid heating artefacts.
2.2 Sample selection and test matrix
Point: representative sampling improves decision quality. Evidence: selecting parts across different package sizes, shielded vs unshielded variants and multiple vendors yields the spread seen in catalogs and lab tests. Explanation: adopt a matrix of DC bias points (0%, 25%, 50%, 75% of expected operating current), several frequencies, and at least two ambient temperatures; define pass/fail thresholds such as ≤20% inductance drop at nominal current and DCR that keeps thermal rise below your board limit.
3 — Measured electrical specs: inductance, DCR, saturation and frequency response
| Metric Type | Observed Range | Design Impact |
|---|---|---|
| Inductance (L) | -20% to -60% drop @Isat | Ripple current & stability |
| DC Resistance (DCR) | 0.05Ω to 1.0Ω | I²R Copper Loss |
| Thermal Rise | 10–30°C/W dissipated | Component lifespan |
3.1 Inductance vs frequency and DC bias (AC behavior)
Point: inductance typically falls with frequency and increasing DC bias. Evidence: measured curves commonly show L at 100 Hz close to nominal, but by 10 kHz L can drop 5–30%; under DC bias near Isat, drops of 20–60% occur depending on core material. Explanation: present L@100Hz, L@10kHz and percent change at operating current; for control-loop stability, target less than ~30% shift at operating current or compensate in the loop design.
3.2 DC resistance, saturation current and temperature rise
Point: DCR and Isat drive copper loss and thermal behavior. Evidence: DCR ranges observed across samples span roughly 0.05Ω to 1Ω for 220µH SMD parts, while Isat ratings vary from under 1 A to several amps depending on footprint. Explanation: use DCR to calculate I²R loss and estimate temperature rise (typical thermal rise 10–30°C/W per watt dissipated); derate Isat by targeting operating current ≤60–80% of specified Isat based on board cooling and thermal constraints.
4 — Loss data deep-dive: separating core loss, copper loss and thermal effects
4.1 Loss decomposition: core vs copper losses
Point: separating core and copper loss gives actionable insight. Evidence: differential measurements — AC loss sweeps without DC bias to capture core behavior and DC-biased power-analyzer runs to capture combined loss — reveal frequency-dependent core loss rising with flux density while copper loss follows I²R. Explanation: convert analyzer readings to watts per unit and plot loss vs frequency and bias; this loss data helps prioritize parts when either core loss or DCR dominates in your operating regime.
4.2 System-level impact: efficiency in a buck converter test
Point: inductor loss maps to converter efficiency delta. Evidence: converter tests at typical switching frequencies (e.g., 100 kHz–500 kHz) and several load points show that a part with 2× DCR or higher core loss can reduce peak efficiency by multiple percentage points and raise hotspot temperatures. Explanation: for low-current rails prioritize low core loss to reduce switching-loss contribution; for higher continuous currents prioritize lower DCR to limit I²R heating.
5 — Case study: real-world selection and measured outcomes
5.1 Candidate comparison (spec-driven selection)
Point: structured comparison narrows candidates efficiently. Evidence: construct a short spec table (L, DCR, Isat, footprint), run identical L vs I and loss vs frequency tests, and rank by measured behavior rather than only datasheet numbers. Explanation: eliminate parts that show >20% inductance drop at nominal current or whose DCR implies thermal rises beyond design limits.
5.2 Final selection and validation steps
Point: in-circuit validation prevents late failures. Evidence: final checks include PCB thermal profiling under load, accelerated margin tests and measuring in-situ L and DCR on assembled boards to catch manufacturing variance. Explanation: validate in the target layout, record thermal maps and confirm the selected part meets both electrical and thermal margins before production sign-off.
6 — Practical design checklist & recommendations
6.1 Selection Rules
- Target operating current ≤60–80% of Isat.
- Prefer shielded parts for sensitive EMI.
- Accept higher DCR if core loss savings are significant.
6.2 PCB & Thermal
- Use large copper pours for heat dissipation.
- Keep switching nodes clear of signal traces.
- Implement post-assembly impedance checks.
SEO Keywords: 220µH SMD power inductor datasheet comparison, 220uH inductor loss at frequency, inductance vs DC bias 220uH.
Frequently Asked Questions
How does inductance vs DC bias affect converter stability for a 220µH SMD power inductor?
Inductance reduction under DC bias raises ripple and can shift control-loop dynamics. Measure L at operating current and ensure the loop compensator accounts for the inductor’s reduced L; if L drops >30% at operating current, plan for loop retuning or select a part with better bias stability.
What test steps reveal whether core or copper loss dominates?
Run frequency sweeps without DC bias to capture core loss behavior, then measure total loss under DC bias and compute I²R from measured DCR to isolate copper loss. If loss increases strongly with frequency but not with DC bias, core loss is dominant.
How should I derate Isat and DCR for production margin?
Derate Isat to 60–80% depending on cooling and thermal constraints; choose DCR such that steady-state I²R loss keeps temperature rise within your board’s allowed delta. Verify with thermal imaging on the actual PCB to confirm margins under worst-case loads.