Point: Datasheets for a 22µH shielded power inductor typically list inductance at 100 kHz/250 mV, DCR in the 40–50 mΩ range, rated current around 3–5 A, plus Isat and ΔT curves; small numeric shifts shift converter efficiency and margin dramatically.
Evidence & purpose: This article shows engineers how to read an inductor datasheet end-to-end, evaluate trade-offs, and validate claims for a 22µH shielded power inductor, with practical calculations and lab-test recipes useful when comparing parts or creating a shortlist from an indductor datasheet.
1 (1) → Quick reference: key datasheet parameters for a 22µH shielded power inductor
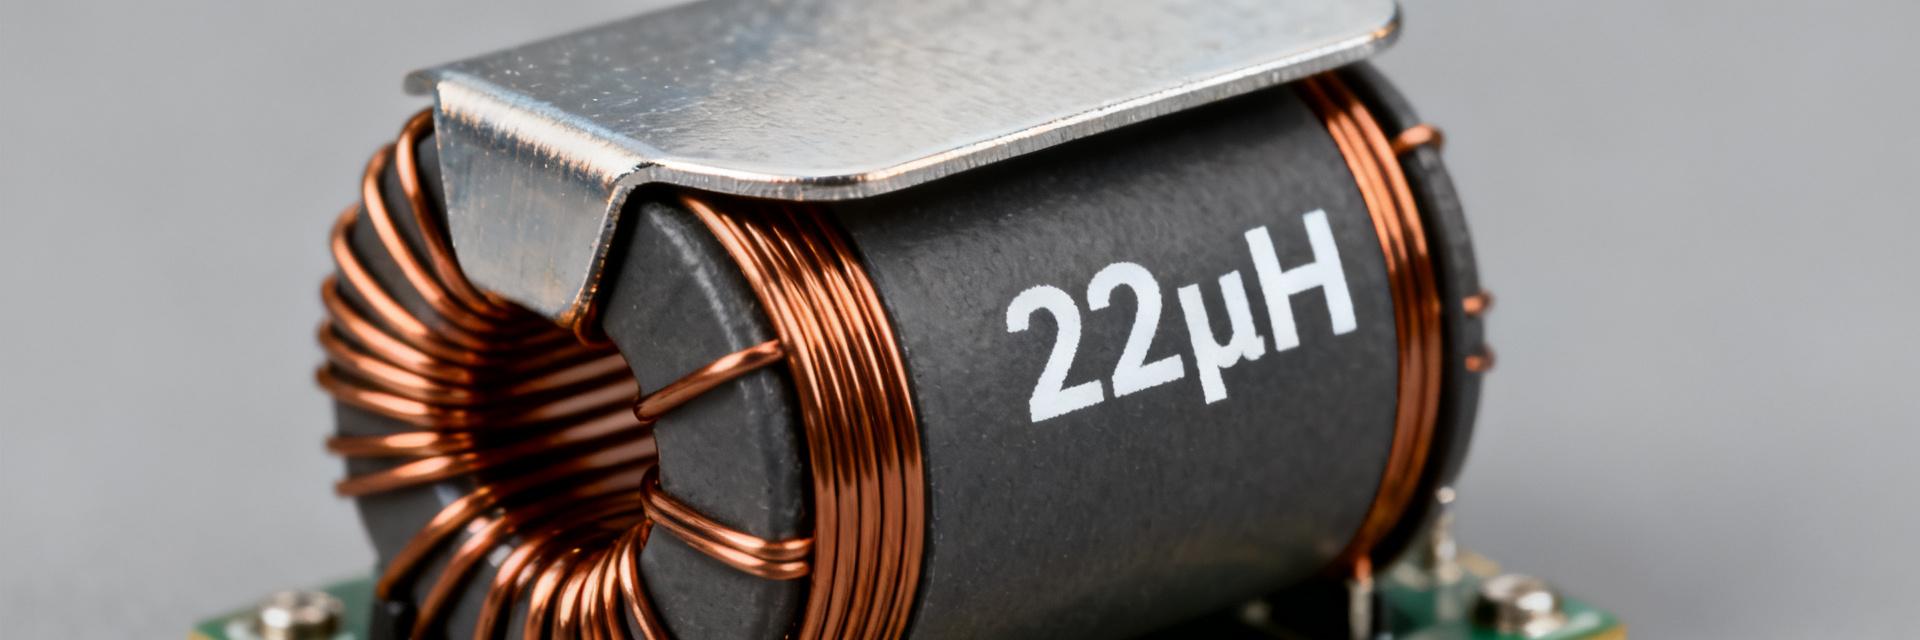
→ Electrical specs to prioritize
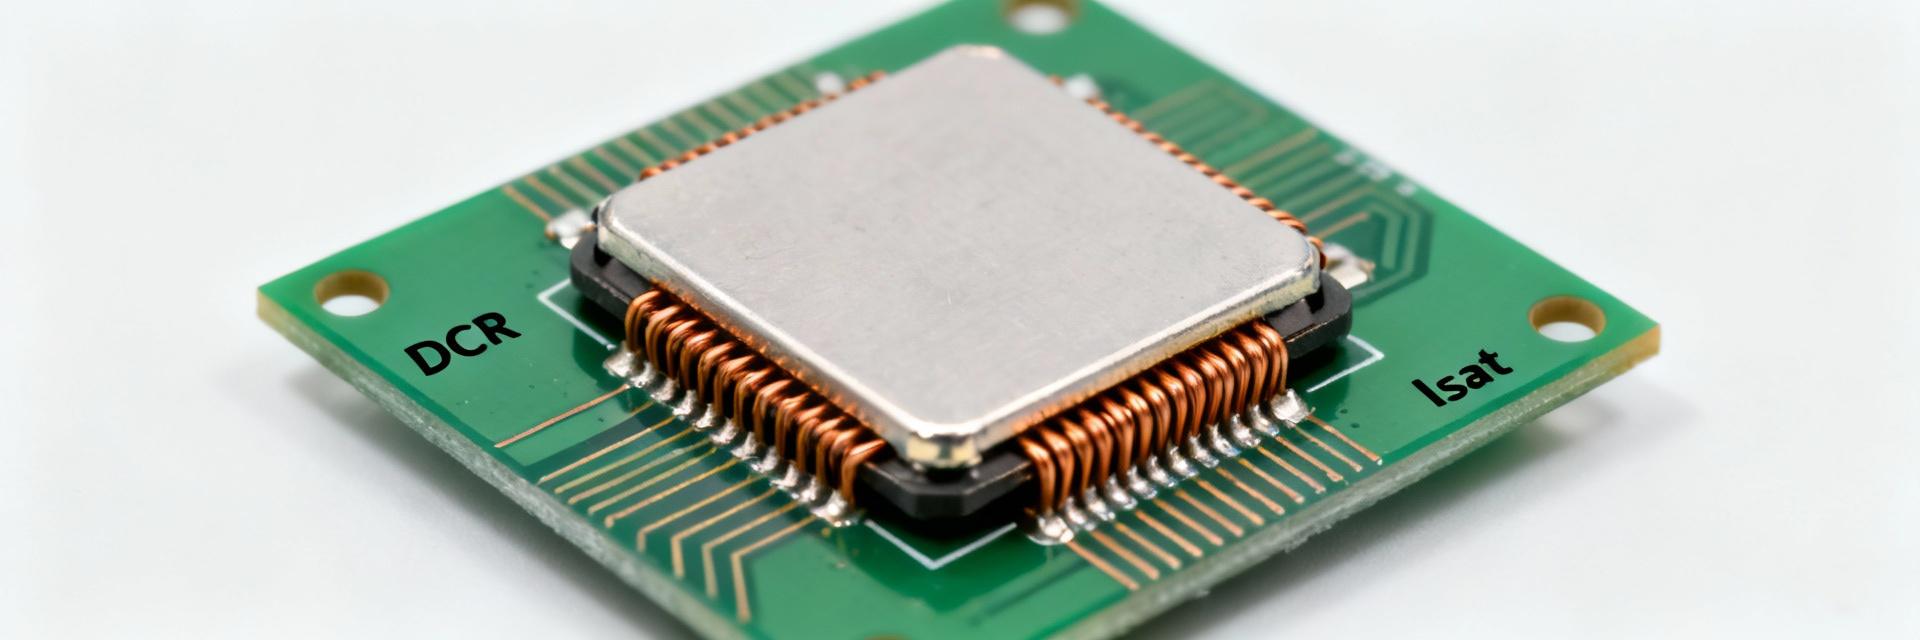
Point: Essential electrical specs are nominal inductance (L) with test conditions, tolerance, DCR (typ/max), rated current (Irms), saturation current (Isat/Ipk), SRF, and impedance vs frequency; test frequency is often 100 kHz/250 mV.
Evidence & explanation: Inductance measured at small-signal 100 kHz/250 mV can overstate L under converter ripple; DCR sets copper loss and P_loss = I_ripple^2 × DCR; Isat defines headroom for transients. Use these to predict ripple current, I^2R loss, saturation margin, and likely EMI performance.
→ Mechanical, thermal & reliability parameters
Point: Package size, height, PCB footprint, solder recommendations, max operating temperature, ΔT graphs, and vibration/shock data determine manufacturability and lifetime.
Evidence & explanation: Thermal derating curves convert Irms to safe operating current under specific ambient conditions; ΔT vs power loss plots let you estimate temperature rise. Verify recommended land pattern and reflow profile to avoid assembly-induced deviations.
2 (2) → Datasheet test methods & what they actually mean (data analysis)
→ Reading measurement conditions correctly
Point: Test-condition mismatches are a leading cause of misleading comparisons.
Evidence & explanation: Checklist: confirm test frequency, signal amplitude, whether Isat is defined at 10% inductance drop, and whether rated current is thermal-limited or saturation-limited.
→ Extracting design numbers
Point: L vs DC bias and DCR vs temperature graphs yield practical numbers.
Evidence & explanation: Read L at expected DC bias to size ripple: ΔI = V × D / (L × f). Compute P_loss ≈ I_ripple^2 × DCR and estimate temperature rise via ΔT.
(3) → Practical selection criteria and trade-offs
→ Efficiency vs size vs saturation: decision matrix
Point: The trade space centers on DCR, package size, and Isat: lower DCR reduces losses but typically increases footprint or cost.
Decision flow: Define target average and peak currents → choose DCR for acceptable I^2R loss → require Isat headroom (20–50%) → verify thermal derating and SRF above switching frequency.
→ Matching to converter topology
Point: Topology and switching frequency affect acceptable ripple and SRF constraints.
Evidence & explanation: Rules of thumb: keep SRF > 5× switching frequency; target peak ripple current such that Ipk
(4) → Validation & lab test recipe to confirm datasheet claims
→ Essential bench tests to run
Point: Validate datasheet numbers with LCR meter sweeps, DC-bias L vs I, and thermal-rise tests.
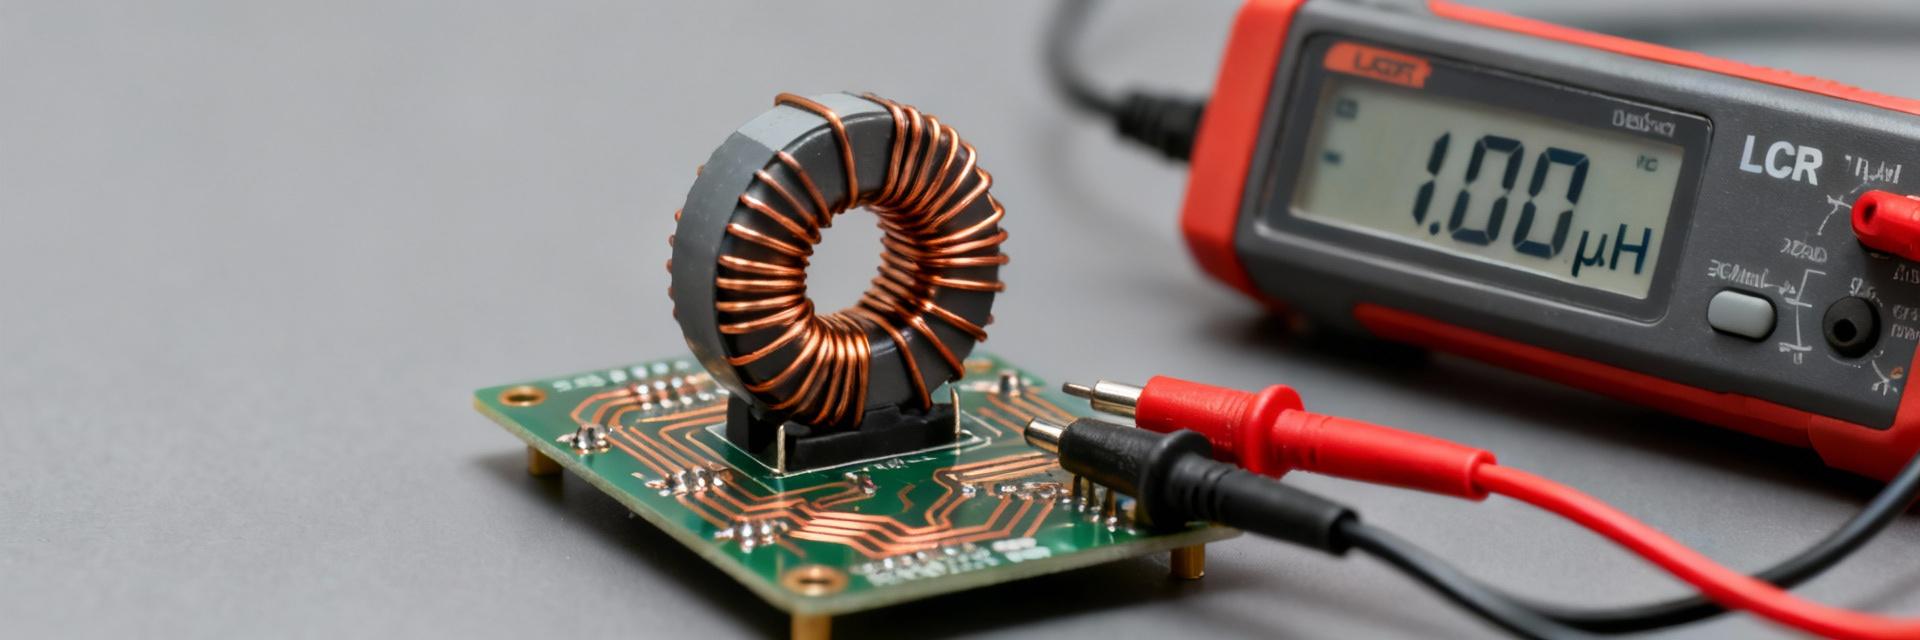
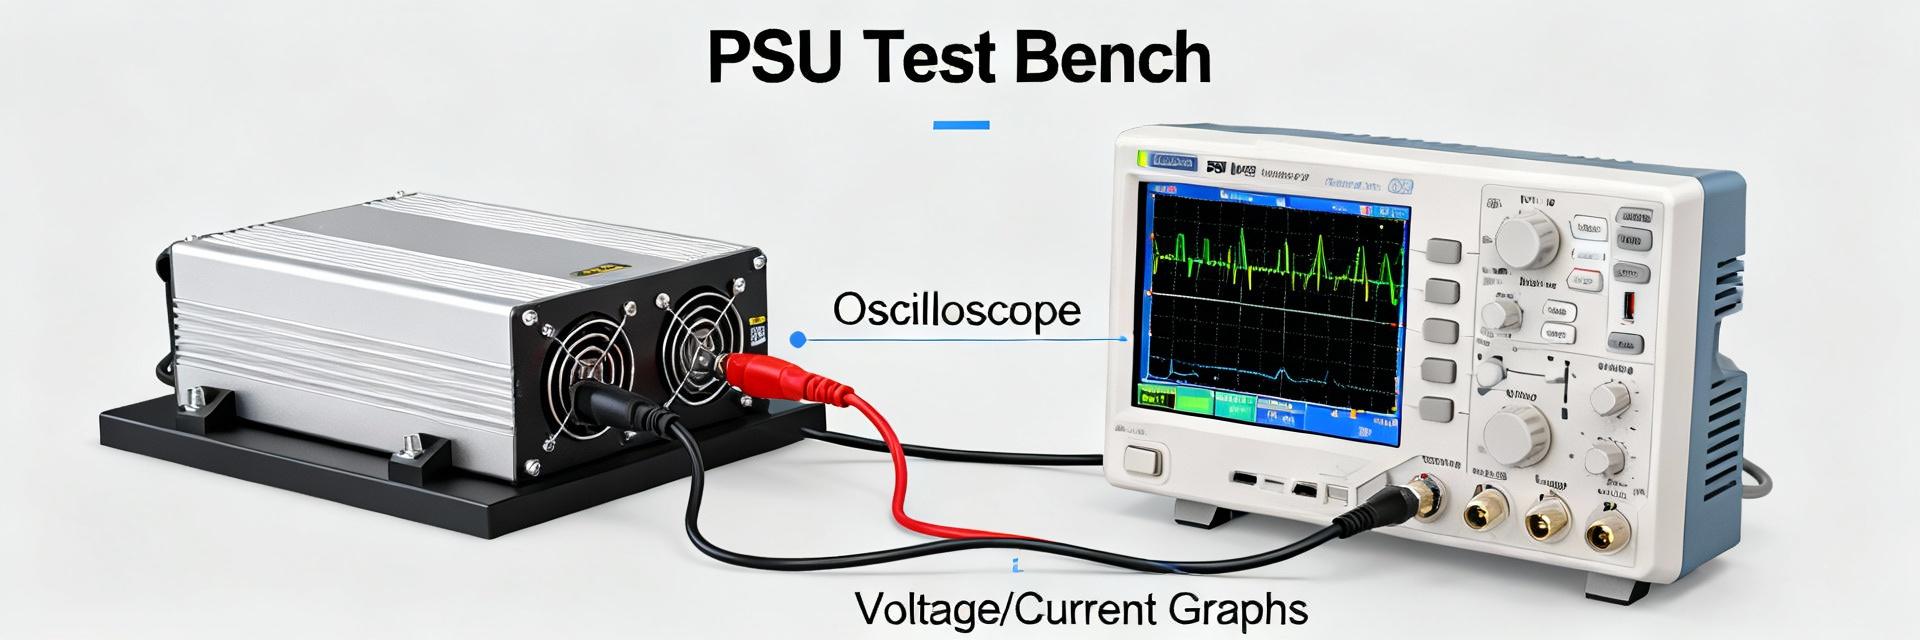
Evidence & explanation: Tools: LCR meter, programmable current source, scope with current probe, thermal camera. Run L at 100 kHz/250 mV to compare to datasheet, then repeat at expected DC bias.
→ Interpreting discrepancies & reporting
Point: When measured values deviate, log test conditions and consider setup errors or lot variation.
Evidence & explanation: Use a simple validation table: test condition, measured value, datasheet value, % deviation, pass/fail. Typical acceptable deviations: ±5–10% for L (low-bias).
(5) → Case study: side-by-side datasheet comparison
→ Example comparison: Part A vs Part B (hypothetical)
| Spec | Part A | Part B |
|---|---|---|
| DCR (mΩ) | 35 (typ) | 55 (typ) |
| Irms (A) | 5.0 | 3.5 |
| Isat (A) | 7.5 | 5.0 |
| SRF (MHz) | 12 | 8 |
Analysis: Using P_loss = I_ripple^2 × DCR, at a 2 A ripple Part A loses <0.14 W while Part B loses 0.22 W—leading to lower ΔT for Part A. Choose Part A for high-current, efficiency-critical designs; Part B for height-constrained boards.
→ Final selection checklist and procurement notes
Point: Before ordering, confirm footprint & height, verify test conditions, and check lead time; reference the indductor datasheet when requesting custom points.
Evidence & explanation: Procurement risk checklist: request lot traceability, check availability, request samples for your solder process, and confirm AEC‑Q qualifications. Document required test points and acceptance criteria.
Summary
- Check electrical specs from the datasheet—L at test conditions, DCR, Irms, and Isat—to estimate ripple, I²R loss, and saturation margin for a 22µH shielded power inductor; mismatched test conditions can mislead comparisons.
- Use L vs DC bias, DCR vs temp, and SRF graphs to calculate expected ripple current, P_loss = I_ripple²×DCR, and ΔT; validate these with bench tests under realistic converter conditions.
- Balance efficiency, size, and saturation headroom via a simple decision flow: target current → select DCR/Isat margins → verify thermal derating and SRF; follow the procurement checklist to reduce risk.
Frequently Asked Questions
What key items should I verify on an indductor datasheet before prototyping?
Verify nominal L with test conditions, DCR (typ/max), Irms definition, Isat definition and % inductance drop point, SRF, ΔT or thermal derating, recommended footprint, and solder profile. Confirm test conditions match your converter’s ripple and DC bias before committing to samples.
How do I estimate inductor losses from datasheet values?
Compute I_ripple from ΔI = V × D / (L × f) using L at DC bias, then use P_loss ≈ I_ripple² × DCR (add DC I²R if significant). Use ΔT curves to translate P_loss to temperature rise and verify it stays within rated limits.
How should lab validation be reported when numbers deviate from the datasheet?
Report test condition, measured value, datasheet value, % deviation, and likely root cause (setup, assembly, lot variance). Include thermal images or thermocouple traces, and recommend pass/fail based on pre-agreed acceptance criteria.