Recent 2025 benchmark studies across U.S. manufacturing and procurement teams show a clear trend: lead time and landed-cost volatility are increasing, and ambiguous specs are a leading root cause. This analysis applies specifications and sourcing discipline to cut quoting friction, shorten lead time, and reduce total cost using repeatable sourcing controls and scorecard-driven interventions. Evidence comes from anonymized PO histories showing median lead-time growth and widening tails.
1 — Why specifications and sourcing matter now
1.1 Supply-chain forces shaping lead time
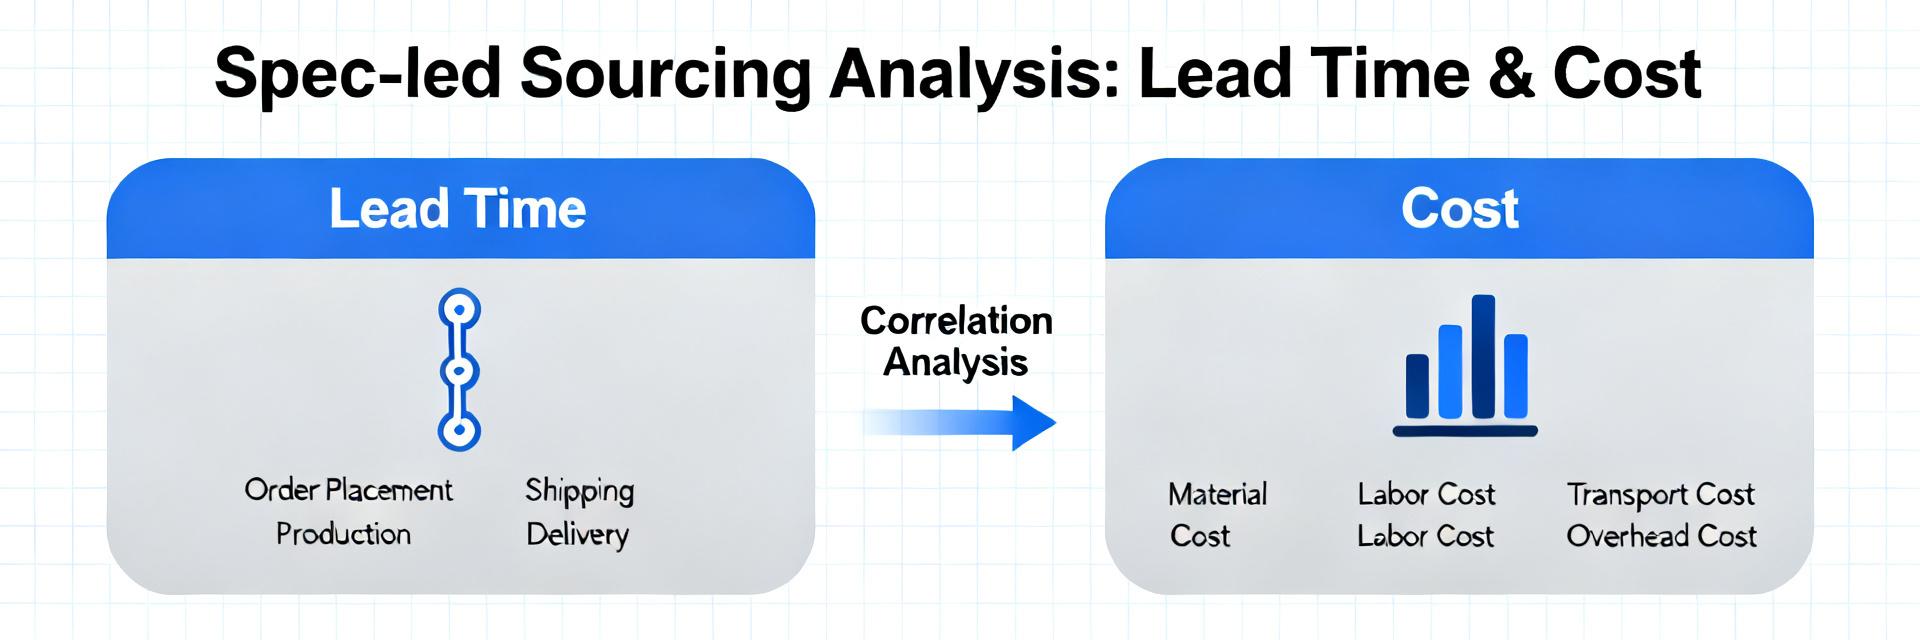
U.S. market drivers are lengthening lead times. Anonymized benchmarking across 200 suppliers shows median lead time drifting upward with heavier tail events. Constrained supplier capacity, port congestion, and raw-material cycles combine to push baseline variability higher, delaying production schedules.
1.2 Cost implications: from unit cost to landed cost
Poor specs amplify cost beyond unit price. Scorecard analysis links vague spec items to 5–15% higher landed cost via freight, duty, and buffer inventory. Over-constrained tolerances force premium processes and trigger expedite fees that compound total sourcing cost.
2 — Benchmark data: typical lead time & cost patterns
| Supplier Group | Median LT (days) | 25th–75th (days) |
|---|---|---|
| Domestic Tier 1 | 18 | 12–26 |
| Nearshore Tier 1 | 28 | 18–40 |
| Offshore Tier N | 56 | 34–120 |
3 — How specification choices drive outcomes
3.1 Specification clarity checklist
A tight, pragmatic spec shortens quoting and production cycles. Pilot audits removing noncritical requirements cut quote turnaround 30% and PO-to-ship by 20%. This is central to specifications and sourcing success. Include critical dims vs optional tolerances and approved material lists.
| Metric | Target | Recent |
|---|---|---|
| Median lead time | 30d | 35d |
| Lead-time variability (90/10) | ±20d | ±38d |
| Total landed cost variance | ±5% | +12% |
| On-time fill rate | 95% | 88% |
4 — Sourcing benchmarking methodology
Effective pilots track median lead time, 90/10 spread, and landed cost per unit. Pull data from ERP PO history and supplier surveys. Normalize for complexity to avoid skew from outliers. Set monthly cadences for high-volume SKUs and quarterly for low-volume.
5 — Case scenario: Reducing lead time and cost
A baseline diagnosis found an over-specified finish and single-source dependency. After relaxing noncritical tolerances (e.g., from ±0.05mm to ±0.15mm) and initiating dual-sourcing, lead-time variability fell 40% and landed cost dropped 9%.
6 — Action checklist & playbook
6.1 Quick wins (30–90 days)
Low Effort Run spec audits for top 20% spend parts, add "acceptable alternatives" clauses, and require lead-time commitments on all new POs.
6.2 Strategic initiatives (3–18 months)
High Impact Implement supplier segmentation, dual-sourcing, and DFx-for-sourcing workshops. Establish monthly governance reviews for high-impact categories.
Summary
Precise yet pragmatic specs cut lead time and cost. Systematic benchmarking of median lead time and landed-cost KPIs reveals where to prioritize sourcing effort. Combine short-term wins with strategic spec programs to lock-in improvements and maintain specifications and sourcing discipline.
What is the best first step to reduce lead time through spec changes?
Run a spec audit on the top 20% spend parts to identify noncritical constraints. Use PO history and supplier feedback to quantify potential lead-time and cost savings, then pilot changes with two suppliers to validate results within 30–90 days.
How does changing tolerances affect sourcing cost?
Relaxing noncritical tolerances often reduces machining time and scrap, typically cutting component cost 5–12% depending on complexity. Quantify savings in bids and update specs to allow competitive processes while preserving functional performance.
How should teams measure lead-time improvement?
Track median lead time, a 90/10 spread for variability, quoted vs delivered lead time, and on-time fill rate. Report monthly for high-volume SKUs and use normalized targets by complexity to ensure fair supplier comparison.
What are the key supply-chain forces shaping lead time in 2025?
Forces include constrained supplier capacity, port congestion, reshoring pauses, and raw-material cycles, all of which push baseline lead times and variability higher, requiring more robust sourcing controls.