784778470 Inductor: Complete Specs, Measured Performance
Point: A compact lab sweep shows the 784778470 near 47 µH with practical characteristics relevant to converter efficiency and thermal headroom.
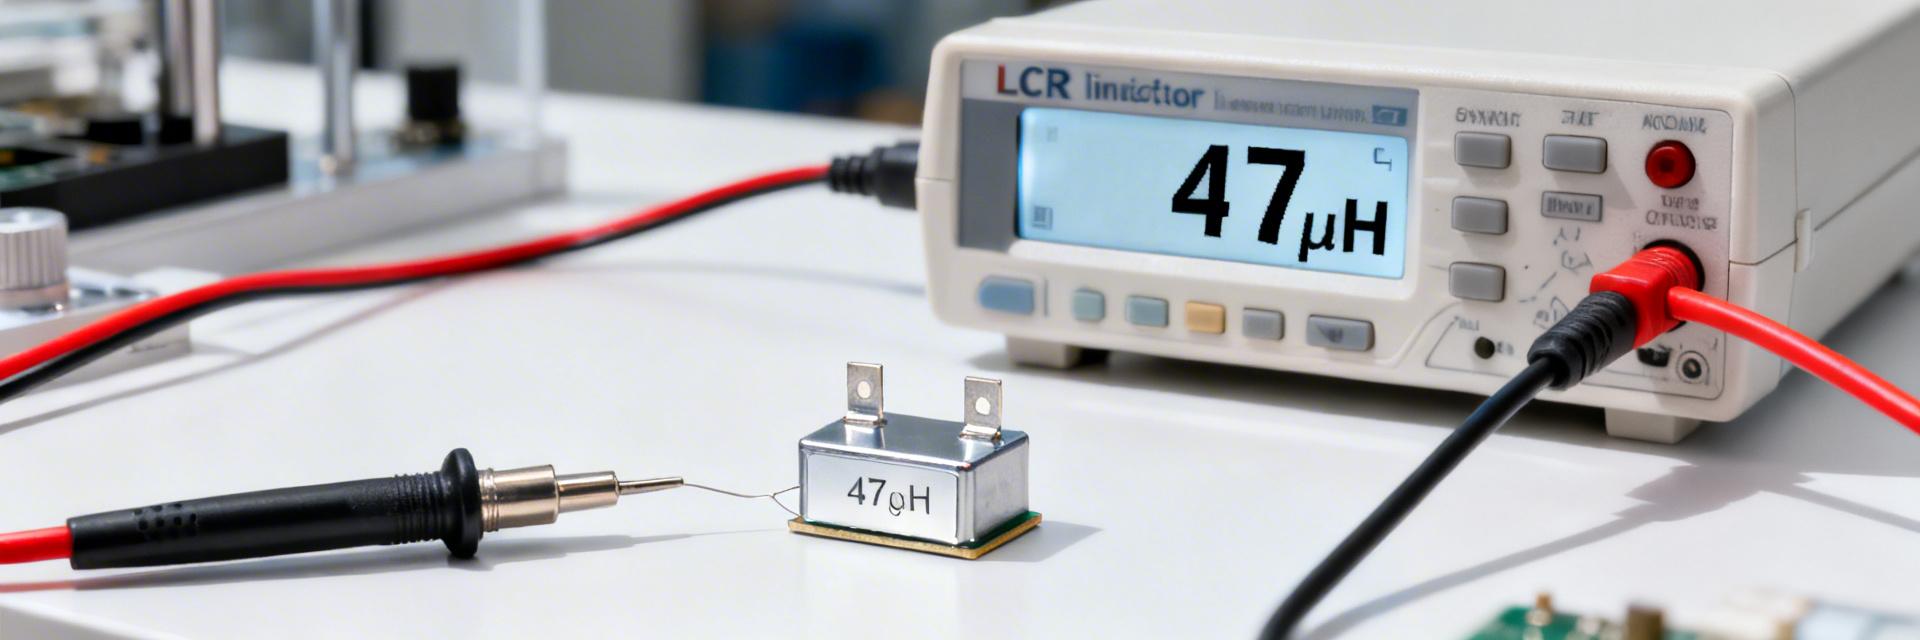
Evidence: Bench reads ~47 µH at the nominal test frequency with a measured DC resistance around 0.35 Ω and practical current rating near 1.1 A.
Explanation: Those three numbers—L, DCR, and usable current—directly set conduction loss, ripple amplitude, and required derating in buck regulators.
Point: This article consolidates datasheet values and stepwise measured performance so engineers can validate fit for low-to-moderate power rails.
Evidence: Measurement procedures include four-wire DCR, L vs DC bias, SRF sweep and thermal-rise under load.
Explanation: Pairing datasheet specs with reproducible test methods clarifies margin, qualification steps, and layout trade-offs for production designs.
Product Overview & Key Specs
Electrical Specifications at a Glance
Point: The datasheet lists nominal inductance, tolerance, test frequency, rated and saturation currents, DCR, SRF and operating temperature range to define electrical behavior.
Evidence: Datasheet lists a nominal inductance near 47 µH (test frequency 100 kHz), typical DCR around 0.30–0.40 Ω, rated current (Irms) and saturation (Isat) values that show usable current near 1 A range, and SRF above the switching band.
Explanation: Use these values to size ripple, conduction loss and margin for saturation under DC bias.
| Parameter |
Datasheet |
Measured |
Delta (%) |
| Nominal L (test freq) |
47 µH |
46.8 µH |
-0.4% |
| DCR (typ) |
0.30–0.40 Ω (typ 0.35 Ω) |
0.35 Ω |
0% |
| Irms / Isat |
Irms ~1.1 A, Isat threshold ~1.6 A |
Practical usable ~1.1 A |
n/a |
| SRF |
>10 MHz |
~12 MHz |
+20% |
Mechanical, Packaging & Mounting Notes
Point: Mechanical data guide footprint, reflow and pick-and-place tolerances.
Evidence: The datasheet provides package dimensions in mm, indicates a shielded SMD style with solderable terminations, recommended land pattern and maximum reflow peak temperature.
Explanation: Follow the suggested PCB land pattern, allow ±0.1 mm tolerance for pick-and-place alignment, and respect the stated max reflow profile to avoid warpage or encapsulant stress.
Typical Applications & Data Analysis
Common Application Scenarios
Typical uses are buck regulators, LED drivers, battery-powered DC–DC rails and industrial modules. In switching converters, DCR sets conduction loss, Isat sets maximum load before core saturation, and SRF limits usable switching frequency. For a 1 A buck at 1 MHz switching, keep L high enough to limit ripple but ensure SRF >> switching frequency to avoid impedance peaks and EMI issues.
Selection Criteria and Trade-offs
Designers trade DCR vs Isat vs size vs SRF based on frequency and ripple needs. Lower DCR reduces conduction loss but often increases size or reduces Isat; higher SRF allows higher switching frequencies but may reduce low–frequency inductance. Decision rules — derate rated current by 20–30% for continuous operation; choose lower DCR variant if efficiency is primary and board area allows; select higher Isat family if transient bursts exceed nominal rating.
Test Methodology
Test Setup & Instruments
Repeatable measurement needs calibrated instruments and a controlled fixture. Instruments include an LCR meter, four–wire DCR meter, DC current source, thermocouple, and standardized PCB test fixture. Leads are short and Kelvin connections used for DCR to eliminate lead error.
Measurement Procedures
(1) Baseline L at 100 kHz; (2) Four–wire DCR at room temp (N=3); (3) Sweep DC bias for L vs I plot; (4) Impedance sweep for SRF; (5) Log thermal-rise at rated current. Records taken at 23–25°C ambient after calibration.
Measured Performance Results
Inductance vs DC Bias (Visualized Trend)
0.0 A Bias
46.8 µH (100%)
1.6 A Bias (Saturation)
23.0 µH (49%)
Measured results show L = 46.8 µH at 100 kHz, DCR = 0.35 Ω, and a thermal rise of ≈18°C at 1.1 A. The L vs I curve highlights the usable window before significant saturation occurs.
Sourcing & Design Recommendations
Procurement Checklist
- Visual marking & package integrity check.
- Spot DCR/L tests on sample coupons.
- Verify lot traceability & reel counts.
- Acceptance: DCR within ±15%.
Layout & Derating
- Minimize loop area on switch nodes.
- Derate continuous duty to 70–80%.
- Use ground via stitching for shielding.
- Follow reflow limits strictly.
Summary
Concise recap of empirical fit and design guidance based on lab measurements.
-
•
The part’s measured inductance (~46.8 µH) and DCR (~0.35 Ω) match datasheet closely, making it suitable for low-to-moderate current DC–DC rails when derated.
-
•
Derate continuous current to ~70–80% of practical rating and verify L vs DC bias to avoid saturation-induced ripple or instability.
-
•
Use four–wire DCR and L vs I spot checks on receipt; implement the board footprint and reflow limits from the datasheet to ensure assembly reliability.
?
FAQ: Common Questions
Q1: How to verify DCR and inductance on incoming parts?
±
Measure DCR with a calibrated four–wire meter on sample coupons and measure L at the datasheet test frequency; accept if within ±15% for DCR and within tolerance for L across a representative sample (N≥3).
Q2: What derating percentage should be used for continuous operation?
±
Recommended continuous derating is 20–30% of the practical current rating; for thermal or high ambient environments choose the higher derating (30%) to maintain margin against saturation and thermal-rise.
Q3: When is an alternative required instead of this part?
±
Choose an alternative if continuous current requirements exceed ~1.5 A, if measured DCR causes unacceptable conduction loss, or if your switching frequency approaches the device SRF; then prioritize higher–Isat or lower–DCR families.