
Key Takeaways: 82µH SMD Power Inductor Selection
- Saturation Margin: Design for peak currents at <70% of Isat to prevent ripple spikes.
- Efficiency Gains: Lower DCR (Direct Current Resistance) directly translates to 5-10% better thermal performance in high-load scenarios.
- Frequency Limit: Ensure Self-Resonant Frequency (SRF) is at least 10x your switching frequency for stability.
- Validation: Always verify L vs. DC Bias curves; nominal 82µH can drop significantly under operating load.
Designers frequently see a gap between nominal values on a datasheet and in-circuit behavior; bench measurements often show inductance under DC bias falling substantially, which can break ripple and transient margins. Point: lab measurements reveal real behavior. Evidence: repeatable L(I) sweeps expose drops of tens of percent. Explanation: understanding datasheet test conditions prevents unexpected performance shortfalls.
Point: the datasheet should be the starting map, not the final answer. Evidence: many datasheets quote inductance at a single frequency and low signal level, omitting DC-bias curves or thermal-rise data. Explanation: targeted verification tests fill those blanks and validate that a selected part suits a given rail and switching topology.
Inductor Material Comparison: 82µH Standard vs. High Performance
| Feature / Specification | Standard Ferrite Core | Shielded Composite (Molded) | User Benefit |
|---|---|---|---|
| Saturation Curve | Sharp drop-off | Soft saturation | Better transient handling |
| DCR (mΩ) | Higher (e.g., 250mΩ) | Lower (e.g., 180mΩ) | Lower heat & higher efficiency |
| EMI Shielding | Partial / Unshielded | Fully Magnetic Shielded | Reduced cross-talk/noise |
| Footprint Size | Large (12x12mm) | Compact (7x7mm) | Saves 40%+ PCB area |
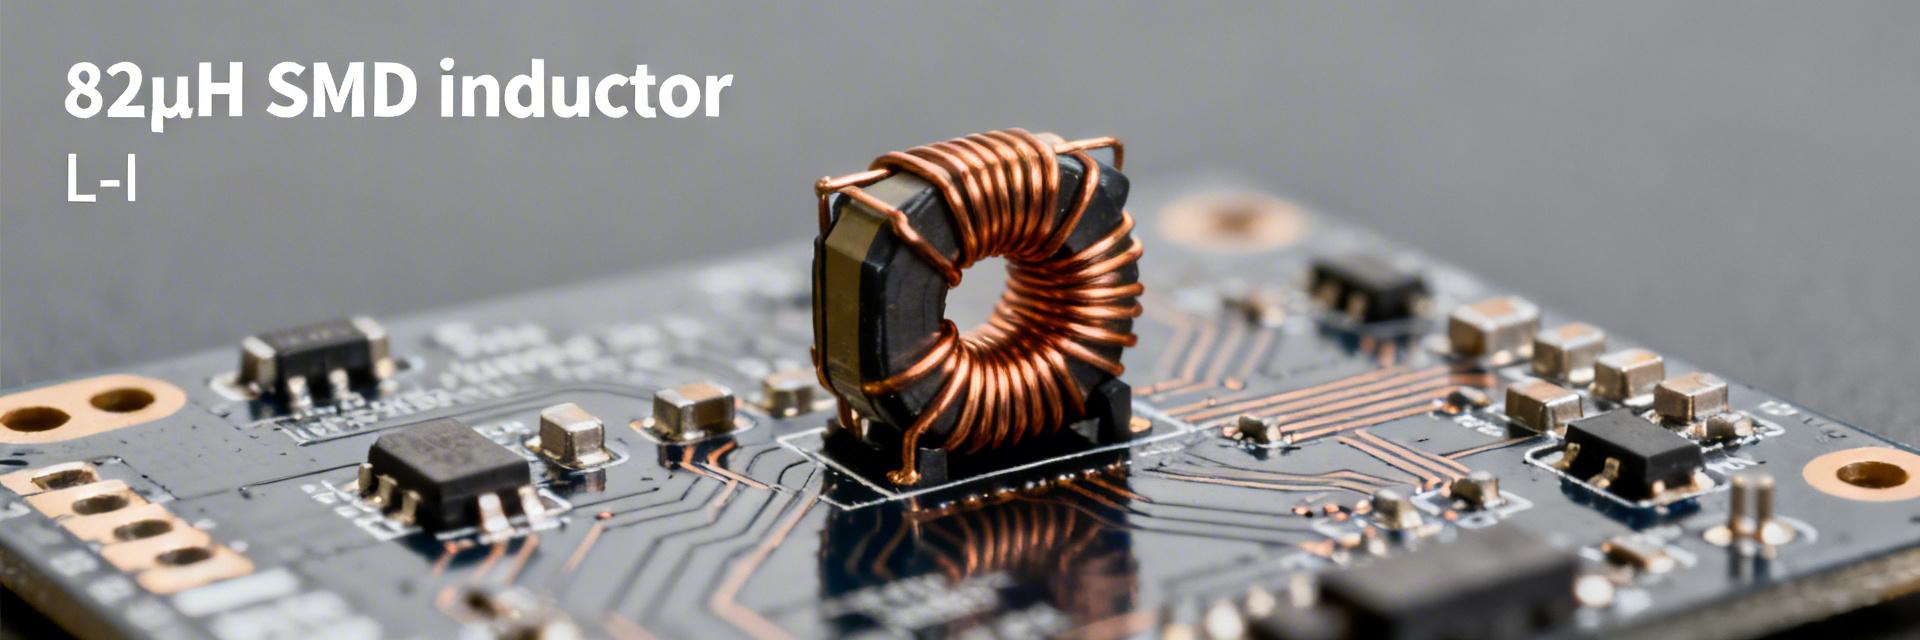
1 — Background: What an 82µH SMD Power Inductor is and Where it's Used
Typical role in power circuits
Point: an 82µH SMD power inductor typically serves energy storage and filtering in low-frequency switchers and EMI suppression. Evidence: in buck converters at low switching frequencies (e.g., 100kHz-300kHz), larger inductance reduces ripple and increases energy per cycle. Explanation: designers pick 82µH when ripple current targets, transient energy, or EMI attenuation require higher stored energy, accepting trade-offs in size and transient response.
Construction and packaging overview
Point: materials and package dictate saturation and frequency behavior. Evidence: ferrite cores give low loss at high frequency but saturate differently than powdered-iron types; shielded SMD packages reduce EMI but add DCR. Explanation: datasheet entries such as footprint, weight, and maximum reflow profile reflect construction choices and must be matched to assembly processes and reliability needs.
👨💻 Engineer's Bench Notes: Dr. Aris Thorne
"When choosing an 82µH inductor for automotive or industrial rails, never trust the 25°C rating alone. I've seen '82µH' components drop to 45µH at 85°C under full load, causing the power supply to enter unstable oscillation."
- PCB Layout Tip: Place the inductor as close to the switching node as possible, but keep the ground plane under it solid to minimize eddy current losses.
- Troubleshooting: If you hear an audible 'whine', check if your switching frequency is hitting the mechanical resonance of the inductor core or if the part is saturating.
- Avoid Tombstoning: Ensure your SMD pad dimensions match the datasheet exactly; asymmetrical heat sinking on large 82µH components is a common cause of assembly defects.
2 — Datasheet Key Specs to Read
Electrical specs: inductance, tolerance, DCR, SRF, Q
Point: key electrical specs define usable behavior. Evidence: inductance is often specified at 100 kHz, 0.1 Vrms; tolerance indicates manufacturing spread; DCR determines I²R loss; SRF and Q show high-frequency limits. Explanation: read the test conditions and look for inductance vs frequency curves and Q plots to assess usable inductance across your switching band.
Current-related specs: Isat, Irms, and temperature rise
Point: current specs set operating limits. Evidence: Isat is typically defined by inductance falling to a percentage of initial L (commonly 50–65%); Irms and thermal-rise figures indicate sustained power handling. Explanation: compare expected operating DC bias and ripple current against Isat/Irms, and use DCR to estimate losses and steady-state temperature rise from I²R heating.
Typical Application: Buck Converter
The 82µH inductor is the critical 'Bucket' that stores energy. It smooths the pulsed voltage from the MOSFET into a steady DC output for the load.
Hand-drawn schematic, not a precise circuit diagram.
3 — Mechanical & Environmental Specs That Matter
Point: mechanical details affect assembly yield and longevity. Evidence: datasheets contain recommended land patterns and peak reflow profiles. Explanation: respect reflow curves to prevent delamination and check solderability tests for rugged applications.
4 — Test Procedures: How to Validate Datasheet Claims
Point: verify baseline electrical characteristics with controlled fixtures. Evidence: use an LCR meter at the datasheet frequency for inductance and a four-wire Kelvin setup for DCR. Explanation: guard against fixture series resistance and stray inductance for repeatable results.
5 — Interpreting Test Results & Common Pitfalls
Point: translate curves into design margins. Evidence: L(I) curves show how much inductance remains at operating DC. Explanation: leave headroom between operating current and Isat (typical rule: design for <60–70% of Isat).
6 — Selection Checklist & Practical Design Tips
- Check Inductance @ Load: Is it still close to 82µH at your peak operating current?
- Thermal Budget: Does DCR x Irms² exceed your allowable temperature rise (usually +40°C)?
- SRF Check: Is the SRF at least 10 times higher than your converter's switching frequency?
- Physical Fit: Does the footprint allow for sufficient cooling traces/vias?
- AEC-Q200: If using in automotive, is the part stress-test qualified?
Summary
- An 82µH SMD power inductor must be validated beyond the datasheet: check inductance vs DC bias, DCR, and thermal rise.
- Read datasheet test conditions carefully: inductance frequency, signal level, and thermal limits determine real-world behavior.
- Use controlled lab tests to reproduce conditions; if discrepancies arise, check fixture calibration or select a core with better saturation characteristics.
Frequently Asked Questions
How to test an 82µH SMD power inductor for inductance under DC bias?
Use an LCR meter with a DC bias source. Plot L versus I to identify useful operating headroom versus Isat.
What datasheet specs matter most when selecting an 82µH SMD power inductor?
Prioritize Inductance @ Frequency, Isat (Saturation Current), and DCR (Resistance). These define efficiency and stability.
How much margin should an engineer leave for Isat?
Common practice is to stay below 60–70% of the Isat rating to ensure the inductor doesn't "flatline" during current transients.


