
Point: The short hook outlines scope and terms used. Evidence: The terms datasheet and performance are used here to frame specification interpretation and bench validation. Explanation: Readers will get compact benchmarks labeled as “sampled datasheet benchmarks,” practical lab protocols, PCB layout rules, procurement red flags, and a checklist to validate manufacturer claims under realistic converter conditions.
Why a 220µH SMD Power Inductor Matters (Background)
Point: A 220µH value sits in a band commonly used for low-frequency filtering and energy storage in slow-switching converters. Evidence: In buck or boost topologies operating at lower switching frequencies or as input filters, 220µH delivers substantial ripple current smoothing without large peak currents through the magnetics. Explanation: Choosing 220µH trades switching ripple reduction against size and core loss; designers favor it when switching frequency, desired cutoff, and acceptable ripple set an inductance above typical tens-of-microhenry parts.
Role in power circuits
Point: The electrical function is energy storage, ripple filtering, and EMI attenuation. Evidence: In low-frequency DC-DC converters and input filters, 220µH reduces current ripple and lowers peak di/dt feeding downstream stages. Explanation: Practically, a 220µH inductor in a buck at low switching frequency reduces inductor ripple current amplitude proportional to V/L•D/fsw; that yields smoother current waveforms but potentially larger magnetics and different saturation behavior.
Typical package & construction trade-offs
Point: Package size and core material define DCR, Isat, thermal behavior, and EMI coupling. Evidence: Common SMD footprints range from compact 0805- to larger 1812-equivalent packages; construction options include shielded vs unshielded and ferrite vs powdered cores. Explanation: Shielded, powdered-iron cores reduce EMI and stray coupling but often have higher DCR; unshielded ferrite may achieve lower DCR and higher Isat but require layout care for EMI. Choose based on current, thermal budget, and board space.
Key Datasheet Metrics for 220µH SMD Power Inductor (Data analysis)
Point: Interpreting nominal inductance and reported test conditions is critical. Evidence: Datasheets often state nominal inductance with ± tolerance and a test condition such as 100 kHz @ 0.1 Vrms; measured inductance can shift under DC bias and at switching-relevant frequencies. Explanation: Question datasheet L when test frequency or AC amplitude is absent; for converter designs, verify L under expected DC bias and at frequencies near switching harmonics rather than relying solely on low-amplitude, high-frequency lab specs.
Inductance value, tolerance, and test conditions
Point: Tolerance and test frequency control the reported number’s relevance. Evidence: A 220µH nominal part with ±20% tolerance and specified test at 100 kHz may read significantly lower under DC bias or at the converter’s switching spectrum. Explanation: Actionable item — request L vs DC-bias curves or measure L under expected operating current to confirm stored energy and cutoff frequency for filter design.
DC resistance (DCR), rated current (Irms), and saturation current (Isat)
Point: DCR, Irms, and Isat determine losses and usable current range. Evidence: DCR produces I²R loss; Isat specifies inductance reduction under DC bias; Irms implies allowable heating. Explanation: Use P_loss = I_rms² × DCR for steady loss estimates and check manufacturer thermal notes. Example: DCR = 0.1 Ω at 0.5 A gives 0.025 W; at 1.5 A the loss rises to 0.225 W—this scales quickly and maps to temperature rise depending on PCB thermal resistance and copper area.
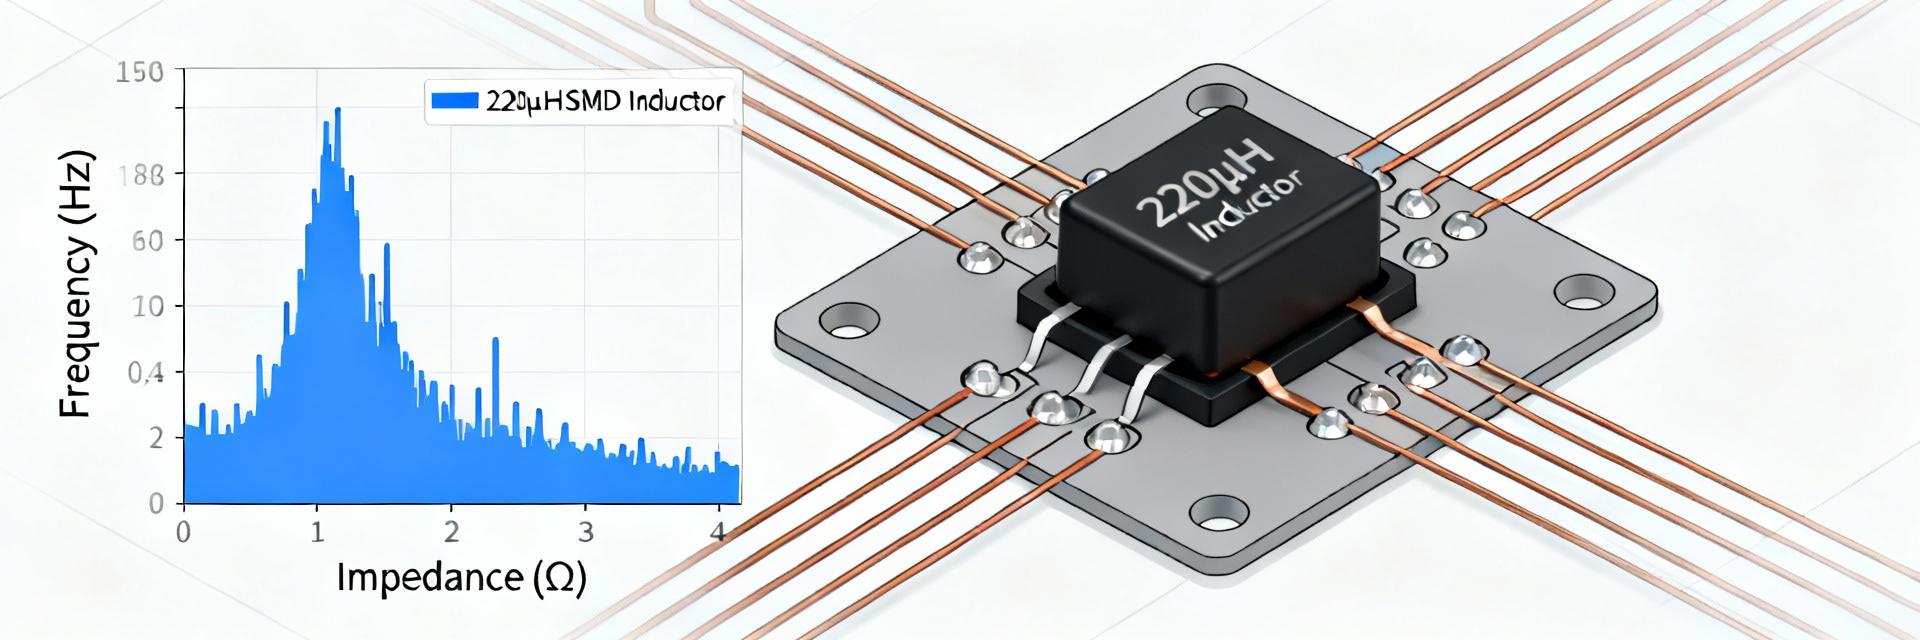
Datasheet Performance Benchmarks (Data analysis)
Point: Consolidated benchmarks aid rapid screening. Evidence: Sampled datasheet benchmarks (n≈12 representative parts) show the following distribution. Use these ranges as initial filters to eliminate parts whose DCR or Isat fall outside your thermal and peak-current margins.
| Parameter | Typical Sampled Range |
|---|---|
| DCR | 0.05 Ω — 0.60 Ω |
| Isat (L drop limit) | 0.4 A — 2.0 A |
| Irms (rated) | 0.3 A — 1.2 A |
| Tolerance | ±10% — ±30% |
| SRF (when given) | >1 MHz typical |
Typical numeric ranges and expected variance
Point: Benchmarks are ranges, not guarantees. Evidence: Manufacturer parts cluster by package and core material; smaller packages bias to higher DCR and lower Isat. Explanation: Actionable item — classify candidate parts by package family and compare their DCR/Isat pairings against your allowed I²R budget and transient peak margins before prototype buys.
Validation & Test Procedures to Verify Datasheet Claims (Method guide)
Point: Bench tests validate operating behavior. Evidence: Standard protocols include LCR meter or impedance analyzer at multiple frequencies, DCR with four-wire micro-ohm meter, and DC bias sweeps to determine Isat and inductance drop. Explanation: Actionable test steps — measure DCR at ambient, perform DC bias increments to find the current where L drops by specified percent (e.g., 10% or 30%), and run pulsed-current tests to check thermal stability.
Bench test protocols
Point: Use controlled instrument settings and uncertainty awareness. Evidence: Recommended LCR settings: low AC amplitude ≤50 mVrms for L measurement, sweep frequencies spanning switching fundamentals and harmonics; measure DCR with Kelvin leads. Explanation: Include acceptance criteria such as DCR within tolerance ±20% of datasheet and Isat meeting required L retention; document measurement uncertainty for pass/fail decisions.
Design Trade-offs & Selection Guide (Method guide)
Point: Layout and thermal strategies reduce loss and EMI. Evidence: Placement near switching nodes, copper pours, and via arrays affect inductor cooling and loop inductance. Explanation: Design rules — maximize copper under and beside the inductor, add thermal vias to inner planes, keep sensitive analog traces separated, and prefer shielded parts where EMI budgets are tight.
Matching inductor selection to application constraints
Point: Selection is a trade-off among size, DCR, Isat, and cost. Evidence: Intermittent pulsed loads tolerate lower Irms but demand higher Isat; continuous loads prioritize Irms and thermal dissipation. Explanation: Checklist step — define peak and continuous currents, allowable temperature rise, size limit, and cost ceiling; score candidates and prototype the top two under realistic loads.
Procurement Checklist & Datasheet Red Flags (Case study + Action)
Point: Datasheet omissions are common red flags. Evidence: Watch for missing test conditions, vague current specs, inconsistent units, or absent temperature derating curves. Explanation: Actionable requests — ask suppliers for L vs DC-bias curves, measured DCR at temperature, solderability reports, and board-level test data before committing to volume buys.
Sample testing and lifecycle considerations
- Require sample pass reports from vendors.
- Specify qualification tests (Thermal cycling, Solderability).
- Define KPIs for production (Efficiency delta, Failure rate).
- Include warranty clauses for long-term supply stability.
Conclusion
Point: Practical takeaway for avoiding efficiency and thermal surprises. Evidence: Use the sampled datasheet benchmarks and perform the outlined validation tests rather than relying on single-point datasheet numbers. Explanation: Select a 220µH SMD Power Inductor only after confirming DCR and Isat/Irms behavior under realistic converter currents and running bench and board-level tests to verify performance and thermal margins.
Key Summary
- Filter Wisely: Use benchmarks (DCR 0.05–0.6 Ω, Isat 0.4–2.0 A) to shortlist parts.
- Thermal Reality: Estimate loss with P = I² × DCR; PCB copper area is the primary cooling mechanism.
- Verify Claims: Bench procedures must include four-wire DCR and DC-bias sweeps for Isat.
FAQ
Point: DCR indicates I²R loss and Isat indicates when L degrades under DC bias. Evidence: Multiply squared current by DCR for steady loss and compare Isat to your expected peak/DC bias. Explanation: If Isat is below your operating peak, inductance will collapse and ripple will increase—prioritize parts with headroom.
Point: Repeatable lab measurements validate claims. Evidence: Use a four-wire ohmmeter for DCR, an LCR analyzer for L at relevant frequencies, and DC-bias sweeps to identify Isat. Explanation: Document instrument settings and acceptance criteria (e.g., L retention limits) before approving parts.
Point: Missing or vague test data is a risk. Evidence: Absence of test conditions, undefined Isat criteria, or no thermal derating curves limit usable data. Explanation: Require clarification or independent sample testing; do not proceed on parts that lack measurable, repeatable data.


