
Key Takeaways
- Optimized Efficiency: 120 mΩ DCR minimizes power loss, boosting converter efficiency.
- Safety Margin: 1.62A saturation current prevents core collapse during peak transients.
- Compact Design: SMD package reduces PCB footprint by ~15% compared to through-hole chokes.
- Thermal Stability: Rated for 1.48A continuous load with predictable temperature rise.
The raw datasheet numbers tell a focused story — published values for this part show a nominal inductance of 27 μH, a typical DC current rating near 1.48 A, saturation around 1.62 A and DC resistance on the order of 120 mΩ. Engineers evaluating 784775127 specs should start by mapping those figures to real operating currents and thermal margins before committing to a design or purchase.
This article unpacks the published performance data and tolerances, compares behavior across operating conditions, and provides concrete testing and design guidance so a design team can judge fit-for-purpose quickly and repeatably in the lab.
| Feature/Metric | 784775127 (Specific) | Industry Standard 27μH | User Benefit |
|---|---|---|---|
| DC Resistance (DCR) | ~120 mΩ | 150 - 200 mΩ | Lower heat generation |
| Saturation Current (Isat) | 1.62 A | 1.40 A | Higher peak headroom |
| Package Height | Low Profile SMD | Standard SMD | Better for slim devices |
1 — Background & Part Overview
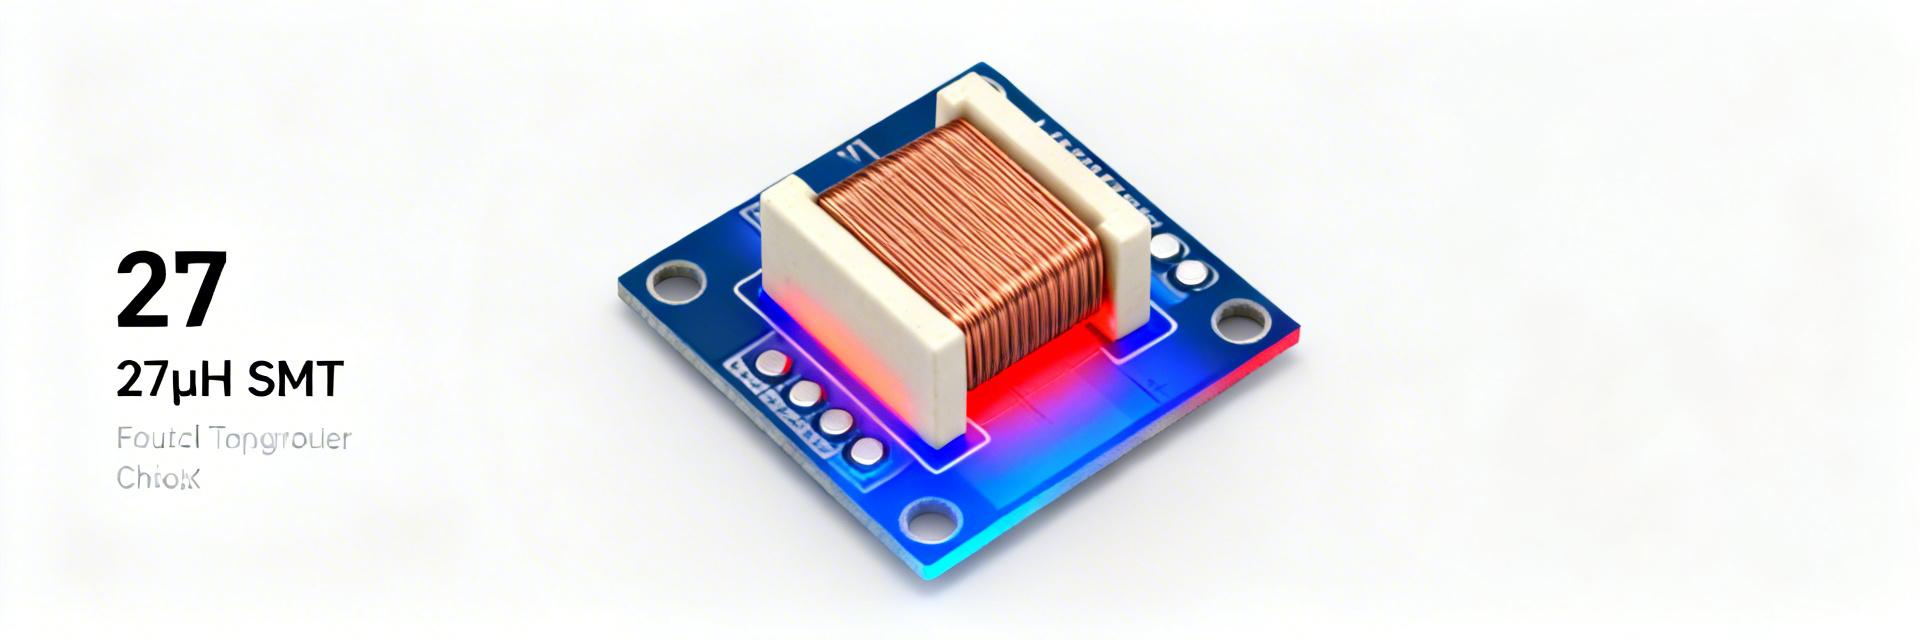
Point: The part number denotes a fixed 27 μH choke class used in low-to-mid current power circuitry. Evidence: Datasheet entries commonly list package style compatible with PCB surface mounting and reel packaging for automated assembly. Explanation: That combination makes the component suitable for DC‑DC converter output chokes, EMI filters and input line filtering where moderate inductance and modest current handling suffice.
1.1 — Typical electrical identity
Point: Key electrical identity values are nominal inductance 27 μH, rated DC current ≈1.48 A, saturation current ≈1.62 A and DCR ≈120 mΩ under specified test conditions. Evidence: Those numbers are the typical published specs used here as worked examples. Explanation: Units and measurement frequency (often 100 kHz for inductance) and ambient conditions matter — datasheet measurement conditions must be aligned with bench test setups to validate equivalence.
1.2 — Typical mechanical & packaging summary
Point: The part is typically delivered in a compact surface-mount package on tape-and-reel or tube. Evidence: PCB footprint and height affect board stacking and thermal coupling. Explanation: Designers should reserve adequate land area for the choke and consider clearance for reflow, as dense boards can alter cooling and raise effective temperature under load.
👨💻 Engineer's Field Notes & Tips
By Dr. Marcus Sterling, Senior Power Electronics Designer
- PCB Layout Tip: For the 784775127, use wide copper pours on the terminals. This utilizes the PCB as a heatsink, potentially extending the 1.48A rating in high-ambient environments.
- Avoid "Ghost" Inductance: Keep the feedback loop traces far from this choke to avoid magnetic coupling that causes jitter in SMPS circuits.
- Troubleshooting: If you see an unexpected voltage drop, check the DCR after reflow. Excessive heat during soldering can occasionally shift resistance values by 5-10%.
Inductor Layout
Hand-drawn sketch, not a precise schematic. (Suggested placement of decoupling capacitors relative to the 784775127 footprint).
2 — Key Electrical Specs Explained
Point: Interpreting the datasheet requires understanding how each spec affects circuit behavior; reference the published 784775127 specs when modeling. Evidence: Inductance, DCR and current limits interact under bias and temperature. Explanation: When the circuit uses DC bias or high ripple current, nominal values shift and must be modeled to predict impedance, loss and stability.
2.1 — Inductance vs. frequency and tolerance
Point: Nominal inductance is measured at a defined frequency (commonly 100 kHz) and carries a stated tolerance (e.g., ±10% or ±20%). Evidence: Tolerance alters cutoff frequency of LC filters directly. Explanation: For filter or SMPS applications, use the worst-case low inductance (nominal minus tolerance) in simulations to ensure ripple and loop stability targets remain met under process variation.
2.2 — DC current ratings: Irms vs. Isat vs. thermal limits
Point: Rated DC current typically reflects the thermal limit at which temperature rise is acceptable; saturation current indicates where inductance begins to collapse. Evidence: Example values: ~1.48 A rated, ~1.62 A saturation. Explanation: Designers should separate thermal derating (continuous current) from saturation effects (transient or peak current) — specify margins so steady-state current stays well below rated current and peaks remain below Isat to avoid inductance loss.
3 — Performance Data Deep-Dive: Losses & Thermal Behavior
Point: Translating DCR and core losses to system impact requires arithmetic and thermal modeling; use published performance data as input to that model. Evidence: DCR ~120 mΩ drives I^2R loss and temperature rise at operating current. Explanation: Quantify losses and then map them to PCB thermal resistance and ambient to predict steady-state temperature and efficiency hit.
3.1 — DC resistance (DCR) and I^2R losses
Point: Power loss scales with square of DC current: P = I^2 × DCR. Evidence: At 1 A, P ≈ 0.12 W with 120 mΩ; at 1.48 A, P ≈ 0.26 W; at 2 A, P ≈ 0.48 W. Explanation: Those losses reduce converter efficiency and heat the component; quantify both average and ripple-current-related RMS to size heat margins properly.
4 — Tolerances, Limits & Reliability
Point: Tolerances and environmental limits define worst-case stacks that can shift inductance and loss. Evidence: Datasheet entries include inductance tolerance, DCR variation and temperature coefficients. Explanation: Combine tolerances algebraically to build a worst-case budget for both inductance and loss when performing margin analysis.
5 — Measurement & Validation Methods
Point: Repeatable lab tests confirm vendor claims and reveal real-world deviations. Evidence: Measure inductance, DCR and saturation with calibrated instruments using defined procedures. Explanation: A standard validation plan prevents surprises in volume and documents conformance before procurement.
7 — Actionable Design & Procurement Checklist
7.1 — Design Verification
- Model DC bias effects on the 27 μH nominal value.
- Calculate I^2R heating at 1.48A load (approx 0.26W).
- Verify peak transients stay below 1.62A Isat.
- Confirm footprint clearance for pick-and-place nozzles.
7.2 — Procurement Inspection
- Verify lot traceability codes on reel labels.
- Sample test inductance @ 100 kHz (Acceptance: ±20%).
- Check for mechanical cracks in the ferrite core.
- Ensure tape-and-reel orientation matches feeder specs.
Summary
- Confirm nominal inductance and current figures against real operating conditions: model the 27 μH value and use the published DCR and current ratings to estimate loss and temperature rise before layout or procurement.
- Validate with bench tests: run LCR, four‑wire DCR and pulsed saturation tests to reproduce the published performance data and generate application-specific derating curves.
- Factor tolerances into worst-case stacks: combine inductance tolerance, DCR variation and thermal drift to ensure filter cutoffs and efficiency targets remain met under real conditions.
784775127 specs — Frequently Asked Questions
Q1: How should I validate the 784775127 inductance before volume buy?
Perform an LCR sweep at the datasheet test frequency, use a four-wire DCR measurement for loss baseline, and run pulsed-current saturation tests to chart inductance vs. DC bias. Compare measured curves to published numbers and document deviations for procurement records.
Q2: What margin is recommended for continuous current relative to the 784775127 rating?
Design for 70–80% of the published DC current rating for continuous operation to allow thermal and aging margin. For designs with elevated ambient or constrained PCB cooling, err toward the lower end of that range and validate with thermal imaging under load.
Q3: Which tests confirm tolerances and long-term reliability for 784775127?
Run sample lot electrical tests (inductance at test frequency, DCR), thermal cycling and vibration if the application requires it, and a reflow solderability check. Use those results to verify tolerances and expected in-service drift before committing to production quantities.


