
A practical, test-focused walkthrough to help engineers extract, validate, and apply values from the 784774127 datasheet in real designs.
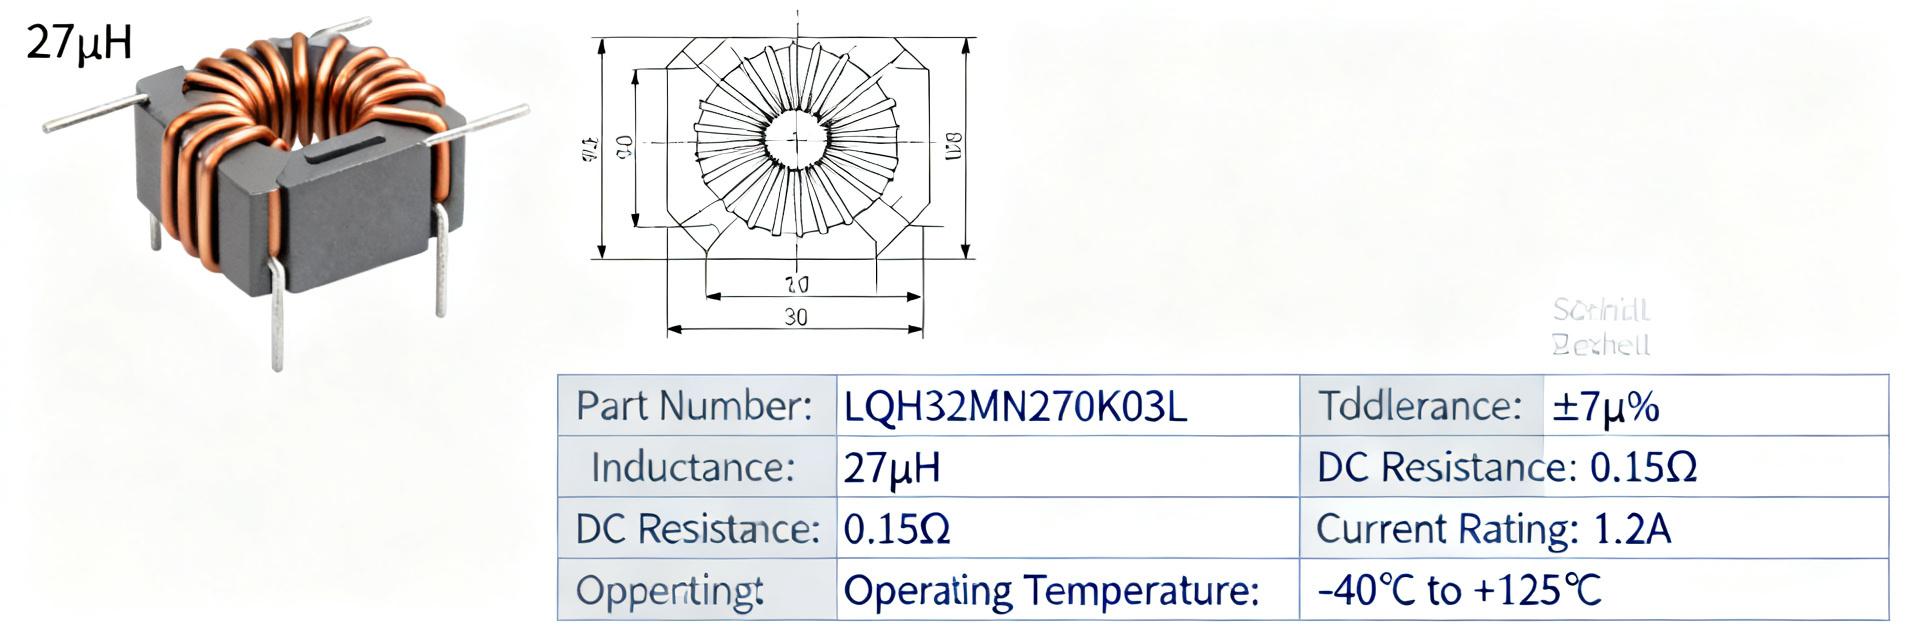
The 784774127 datasheet lists a nominal inductance of 27µH, a rated current in the region of 1.19 A, and a DC resistance near 200 mΩ — figures that immediately define loss, thermal rise, and usable ripple current in power stages. These numbers matter because DCR sets I2R loss, Isat limits usable peak current, and SRF constrains switching-frequency behavior.
1 At-a-glance: Core specs and what they mean
1.1 Quick spec snapshot
Point: Capture the fields that drive selection: inductance (27µH), inductance tolerance, rated current (~1.19 A), saturation current (Isat), DCR (~200 mΩ), SRF, DC bias curves, temperature range, footprint/height, and mounting.
Action: Copy exact units and tolerance bands; flag fields that vary by lot (often DCR and Isat). Pass/fail rule: measured DCR within ±20% of datasheet or Isat equal/above specified minimum qualifies for initial fit.
1.2 Interpreting tradeoffs
Point: Rated current, Isat, and DCR indicate tradeoffs between loss, headroom, and size. A 27µH inductor specs showing ~1.19 A rated current with DCR ≈200 mΩ implies meaningful I2R loss at medium currents.
Measurement: Set a design margin (e.g., keep operating DC current ≤ 70% of Isat). Pass/fail: if inductance drops >30% at intended DC bias, reject for application.
2 Electrical performance: reading and analyzing test curves
2.1 Inductance vs. DC bias and frequency
Expect inductance to fall as DC current increases; frequency dependence appears near SRF. Datasheet curves typically show percent inductance vs. DC bias and vs. frequency. Procedure: measure L at 100 kHz and at the datasheet’s rated current using an LCR meter with DC bias. Pass/fail: L at operating bias should remain ≥70% of nominal for energy-storage applications.
2.2 DCR, impedance and Q-factor
DCR sets DC losses; impedance and Q show frequency behavior and loss distribution. For converters, low DCR is prioritized; for filters, higher Q may be useful. Procedure: measure DCR with a 4-wire ohmmeter and sweep impedance with an impedance analyzer at 100 Hz–1 MHz. Pass/fail: measured DCR ≤ +20% of datasheet and Q peak consistent with expected performance.
3 Thermal, mechanical and reliability
3.1 Thermal derating
Datasheet thermal curves determine derating. Exceeding rated ambient causes excessive temperature rise. Pass/fail: temperature rise must remain below the datasheet’s permitted delta (usually 40°C above ambient).
3.2 Soldering & Mechanical
Reflow profile and mechanical stresses affect assembly yield. Procedure: verify part survives one standard reflow profile. Pass/fail: no visible damage or DCR shift >10% after reflow/vibration.
5 Application guidance & substitution
The 27µH value suits LC filters, EMI chokes, and low-frequency buck outputs. Ensure Isat ≥ peak current × 1.4 and SRF at least 5× switching frequency. Substitution risks are minimized by matching L tolerance and Isat first. Run side-by-side converter tests; if efficiency loss or temperature rise exceeds thresholds, revert to the qualified part.
Summary
- Extract core numbers (L=27µH, DCR≈200 mΩ, Rated≈1.19 A) to set loss and thermal budgets before layout.
- Run basic bench tests (4-wire DCR, L at DC bias) and require measured DCR ≤ +20% and L@bias ≥70% for acceptance.
- Perform system-level verification (efficiency, ripple, thermal) to catch board parasitics and ensure temperature margins.
Frequently Asked Questions
How should an engineer verify values in the 784774127 datasheet before qualifying a design?
Measure DCR with 4-wire technique, L at intended operating DC bias and switching frequency, find SRF with a network analyzer, and sweep DC to locate Isat. Compare measured DCR ≤ +20% and L@bias ≥70% of nominal.
What are the key bench pitfalls when testing 27µH inductor specs?
Pitfalls include improper probe grounding adding series inductance, measuring without DC bias, and ignoring board trace resistance. Mitigate by using Kelvin leads and calibrated LCR settings.
When is substitution safe for a 27µH inductor in a power stage?
Substitution is safe when inductance tolerance, Isat, thermal current, and footprint match closely. Validate with side-by-side efficiency and thermal tests in the actual circuit.


